A liquidity ratio that measures how many times a company pays its creditors over an accounting period
The accounts payable turnover ratio is an important liquidity metric that measures how efficiently a company manages payment of its short-term liabilities.
This ratio shows how many times a company pays off its accounts payable during a period. A higher ratio indicates greater liquidity and financial health.
In this comprehensive guide we’ll break down everything you need to know about the accounts payable turnover ratio including
- Definition and Formula
- Calculation Example
- Interpretation of the Ratio
- Accounts Payable Turnover Days
- Use in Financial Modeling
- Pros and Cons
- How to Improve
- Industry Comparison
- FAQs
Let’s get started.
What is the Accounts Payable Turnover Ratio?
The accounts payable turnover ratio shows how many times a company pays off its average accounts payable during an accounting period like a quarter or year.
It measures how efficiently and frequently a company pays creditors and suppliers Accounts payable represents short-term liabilities owed to creditors and suppliers for inventory purchases and other goods/services used in operations,
Accounts Payable Turnover Ratio Formula
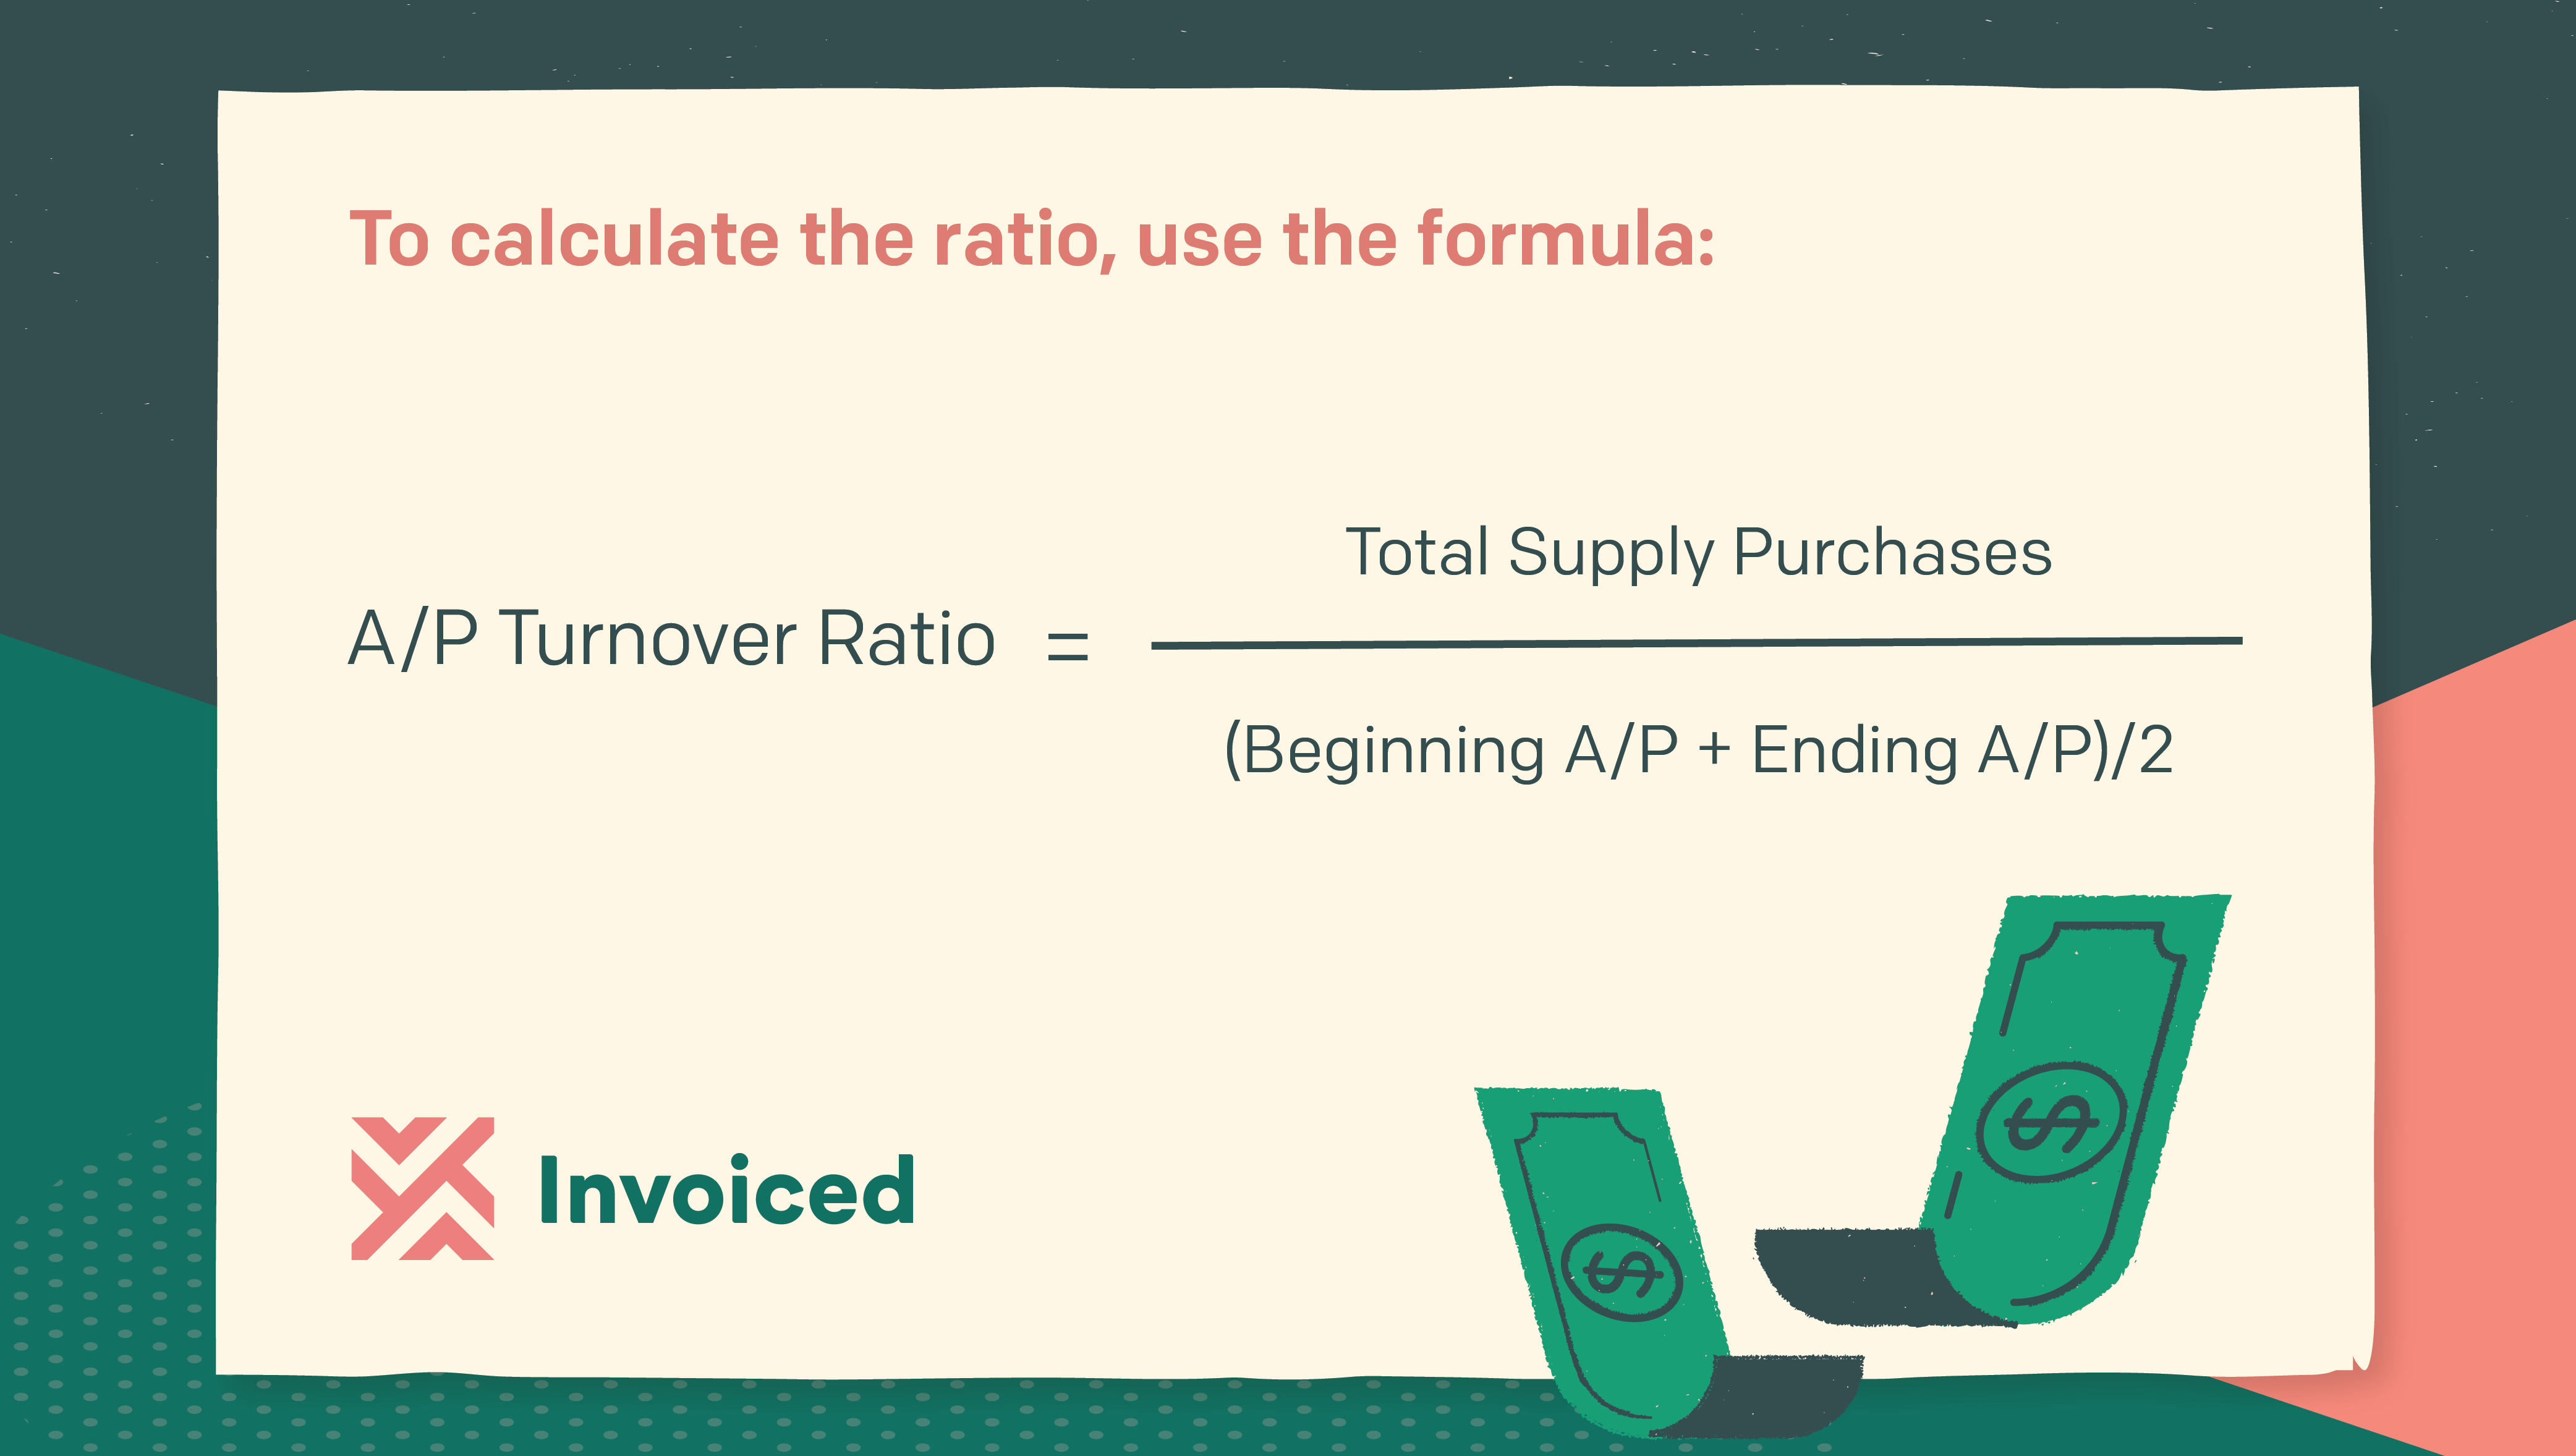
The formula to calculate accounts payable turnover ratio is:
Accounts Payable Turnover Ratio = Net Credit Purchases / Average Accounts Payable
Where:
- Net Credit Purchases = Total purchases on credit – any purchase returns
- Average Accounts Payable = (Beginning AP balance + Ending AP balance) / 2
This measures how many times average accounts payable gets paid off annually through credit purchases.
Accounts Payable Turnover Ratio Example
Let’s look at an example to understand how to calculate accounts payable turnover ratio:
- Net credit purchases during the year = $500,000
- Beginning accounts payable = $100,000
- Ending accounts payable = $150,000
First, we find the average accounts payable:
Average AP = ($100,000 + $150,000) / 2 = $125,000
Now we plug this into the formula:
Accounts Payable Turnover Ratio = $500,000 / $125,000 = 4 times
This means the company turned over its average accounts payable 4 times during the year.
Interpreting the Accounts Payable Turnover Ratio
So what does this metric indicate for a company? Here are key insights:
-
Higher ratio = greater liquidity – A high accounts payable turnover ratio indicates the company is efficiently paying suppliers and managing working capital. This improves liquidity.
-
Lower ratio = potential problems – A low ratio may mean the company is struggling to pay off suppliers and thus lacking liquidity. However, it could also mean the company has negotiated favorable payment terms.
-
Compare to competitors – The ratio is best assessed in relation to industry peers. Compare your ratio to competitors to better judge if it is high or low.
-
Assess trends – Look at the trend in the company’s ratio over time. Is it improving or worsening? Steady trends are preferable.
While a high ratio is generally good, an extremely high ratio exceeding the industry norm could indicate suppliers are demanding immediate payment or the company is sacrificing discounts for early payment. Overall, a moderate ratio aligned with industry benchmarks is ideal.
Accounts Payable Turnover Days
The accounts payable turnover days metric shows the average number of days it takes a company to pay off its suppliers and creditors.
It complements the turnover ratio by converting it into days for easy interpretation.
The formula is:
Accounts Payable Turnover Days = 365 / Accounts Payable Turnover Ratio
For the example company above with turnover ratio of 4, the payable turnover days would be:
365 / 4 = 91 days
This means the company takes approximately 91 days on average to pay off its accounts payable.
Advantages of High Accounts Payable Turnover
A higher accounts payable turnover ratio has several benefits for a company:
-
Shows ability to cover short-term debt – Rapid turnover indicates the company can efficiently pay suppliers from sales or cash flow. This demonstrates effective working capital management.
-
Lowers liquidity risk – Fast turnover lowers likelihood of late payments, reducing risk of supply chain disruptions. Suppliers offer better terms when paid promptly.
-
Enhances credit rating – Responsible payables management improves creditworthiness with suppliers and lenders, enabling access to lower cost of capital.
-
Creates flexibility – Minimizing payables leaves more working capital available for growth opportunities and dealing with emergencies.
Overall, a higher turnover ratio gives managers more financial flexibility and control.
Disadvantages of High Turnover Ratio
However, an exceptionally high turnover ratio has some downsides as well:
-
Increased cost – Paying creditors quickly reduces chances to take trade discounts for early payment. This raises procurement costs.
-
Suboptimal cash flow – Excessively high turnover could mean the company is sacrificing opportunities to defer payments and optimize cash flow cycles.
-
Weak bargaining position – Very high turnover may signal the company has poor bargaining power with suppliers, forcing it to pay immediately.
Ideally, companies want to balance taking advantage of credit terms while demonstrating strong liquidity.
How to Improve Accounts Payable Turnover Ratio
Here are some tips for improving accounts payable turnover ratio:
-
Negotiate favorable supplier terms – Extending credit terms gives flexibility to make payments when optimal rather than rushed.
-
Take supplier discounts – Capture early payment discounts from suppliers to reduce costs but don’t overpay early.
-
Optimize invoicing processes – Ensure supplier invoices are processed promptly so payments aren’t delayed.
-
Schedule payments strategically – Space out payments evenly based on due dates rather than paying everything ASAP.
-
Manage inventory efficiently – Reduce excess inventory to lower purchasing needs and account payables. Use just-in-time inventory.
-
Accelerate collections – Improve collection of receivables to increase cash available for paying suppliers.
Accounts Payable Turnover Ratio by Industry
Accounts payable turnover varies widely by industry based on business models and credit terms. Typically, companies with the highest ratios are in manufacturing industries like automobiles that require large inventories. Industries with lowest ratios include services and software with minimal inventories.
Here are average accounts payable turnover ratios by industry:
- Automobiles: 9.5
- Aerospace/Defense: 8.2
- Industrial Equipment: 7.9
- Chemicals: 6.8
- Business Services: 5.2
- Computer Software: 4.1
- Health Technology: 3.9
Compare your company’s ratio to benchmarks in your specific industry to better evaluate it. The ratios vary significantly across industries.
Accounts Payable Turnover Ratio in Financial Modeling
The accounts payable turnover ratio is an important assumption used in financial modeling for the 3 statement projections. It helps determine the accounts payable balance.
For example, if the payable turnover is 30 days, the accounts payable balance would be calculated as:
Accounts Payable = (Cost of Goods Sold * 30) / 365
This shows that 30 days of COGS expense on credit is carried in the AP balance. The turnover days drives how AP is projected in the model based on sales and COGS forecasts.
Accounts Payable Turnover Ratio Example for Financial Modeling
Here is an example projecting accounts payable in a financial model based on the turnover days:
- Cost of Goods Sold in Year 1 = $1,000,000
- Accounts Payable Turnover Days = 30
Accounts Payable = ($1,000,000 * 30) / 365
= $82,192This $82,192 would be the end of year 1 AP balance in the balance sheet, assuming no beginning AP balance.
Accounts Payable Turnover Ratio: Pros and Cons
Here are the key pros and cons of using the accounts payable turnover ratio:
Pros
- Helps assess short-term liquidity position
- Useful for credit analysis
- Indicates efficiency in supplier payment
- Helps benchmark against peers
- Identifies trends over time
Cons
- Can be distorted by changes in credit terms
- Difficult to interpret without industry context
- Does not factor invoice processing delays
- Can encourage overpayment to suppliers
- Limited view of comprehensive liquidity
While a simple and useful metric, the accounts payable turnover ratio should be assessed in combination with other liquidity and working capital ratios to get a complete picture.
Accounts Payable Turnover Ratio FAQs
Here are some frequently asked questions about the accounts payable turnover ratio:
What is a good accounts payable turnover ratio?
A ratio between 3 to 8 is generally ideal depending on the industry. Very high ratios above 10 may indicate excessive haste in paying suppliers.
What does a high accounts payable turnover ratio indicate?
It typically indicates strong liquidity and the ability to take advantage of supplier credit terms efficiently. However, an excessively high ratio may indicate suppliers are demanding fast payment.
**What does a
Example of Accounts Payable Turnover Ratio
Company A reported annual purchases on credit of $123,555 and returns of $10,000 during the year ended December 31, 2017. Accounts payable at the beginning and end of the year were $12,555 and $25,121, respectively. The company wants to measure how many times it paid its creditors over the fiscal year.
Therefore, over the fiscal year, the company’s accounts payable turned over approximately 6.03 times during the year. The turnover ratio would likely be rounded off and simply stated as six.
Download the Free Template
Enter your name and email in the form below and download the free template now!
