Overall Equipment Effectiveness (OEE) is a metric that manufacturing organizations use to measure the performance of their production operations. As someone working in the manufacturing industry, I often get asked – what exactly is OEE and why should we care about it? In this article, I’ll explain what OEE is, why it’s important, and how manufacturers can use it to improve productivity.
What Is OEE?
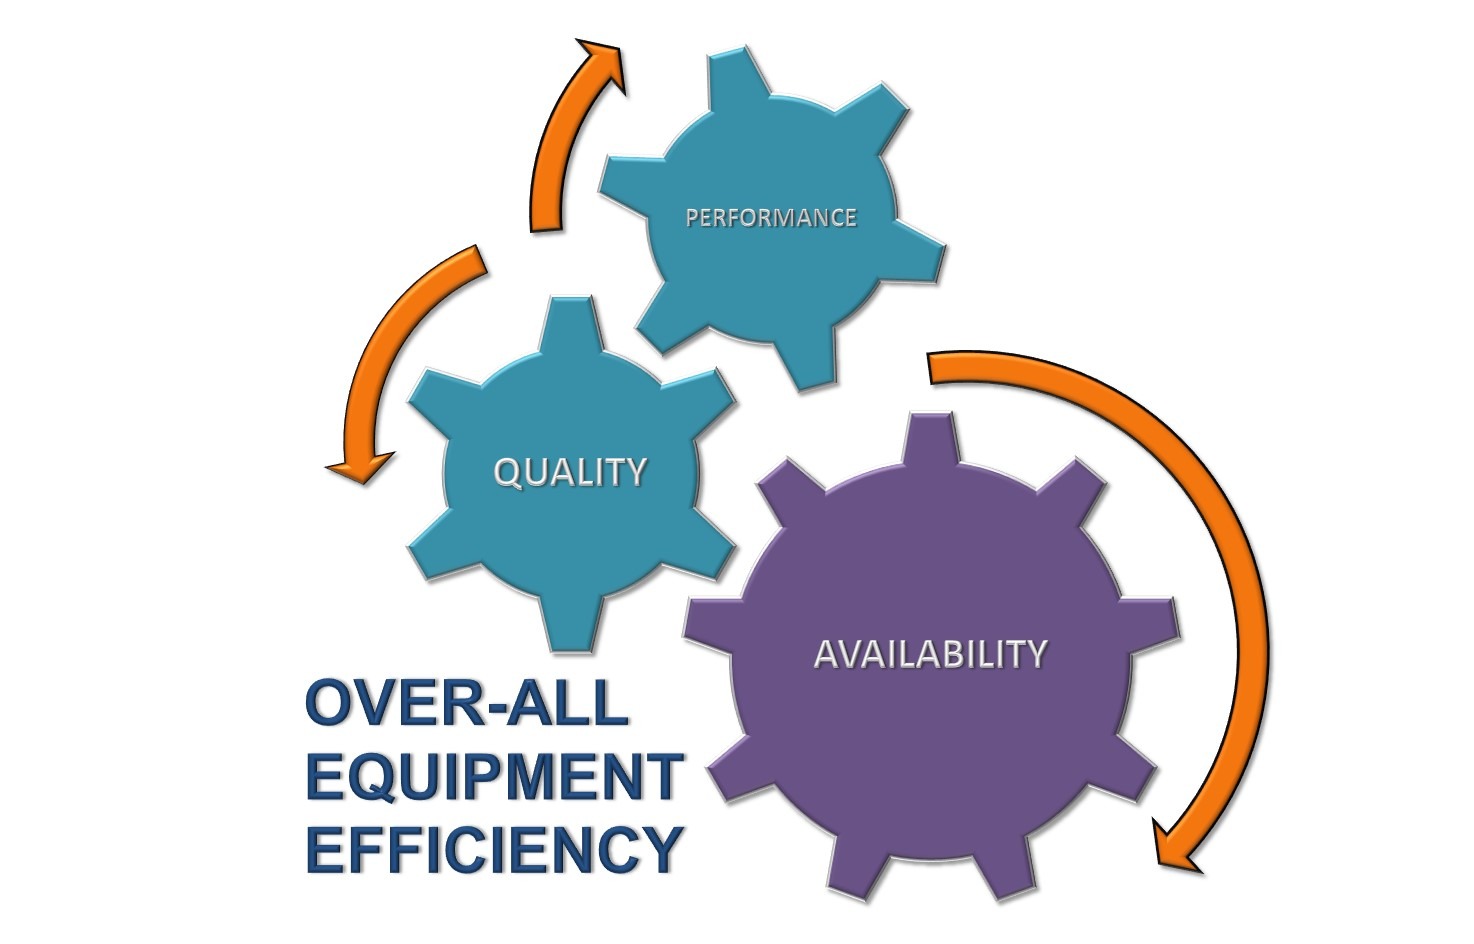
OEE is calculated by taking into account three factors
-
Availability – The percentage of scheduled production time that the equipment is available to operate. This accounts for downtime from equipment failures, changeovers and planned maintenance.
-
Performance – The speed at which the equipment runs as a percentage of its designed speed. This accounts for slow cycles, small stops, and idling time.
-
Quality – The good units produced as a percentage of the total units started. This accounts for scrapped or rejected products that need rework.
By multiplying these three factors together, manufacturers arrive at the overall OEE percentage:
OEE = Availability x Performance x QualityAn OEE score of 100% means you are manufacturing only good parts, as fast as possible, with no stop time. So in simple terms, OEE shows how well a manufacturer utilizes their assets by measuring losses. The higher the OEE, the better the asset utilization.
According to sources, world-class OEE is considered to be 85% or greater. However, average plants often operate in the 60-65% range. This indicates significant room for improvement by addressing causes of downtime, speed losses, defects, and other wastes.
Why Should Manufacturers Care About OEE?
Here are some of the main reasons OEE matters:
-
It identifies losses and improvement opportunities – By breaking OEE down into its three factors, manufacturers can pinpoint exactly where the losses are occurring. This allows them to focus improvement efforts on the biggest issues.
-
It facilitates benchmarking – Manufacturers can use OEE to compare the performance of different assets or production lines. They can also benchmark against industry standards.
-
It quantifies the impact of improvements – An increase in OEE demonstrates hard cost savings from reduced cycle times, less downtime, higher yield, etc.
-
It justifies investments – The ROI of capital investments to improve asset performance can be calculated using OEE.
-
It indicates when assets need replacement – A consistently low OEE score may indicate an asset has reached the end of its useful life.
-
It enables goal-setting – Manufacturers can use OEE targets to drive continuous improvement. For example, increasing OEE by 5% year over year.
As you can see, OEE is much more than just a number. It’s a metric that provides deep insights into manufacturing performance and drives data-driven decision making. Even small improvements in OEE can translate to millions in cost savings and increased production capacity.
How to Calculate OEE
While the OEE calculation itself is straightforward, measuring the underlying components requires a data collection system. Here are the basic steps:
-
Determine planned production time – This is the available working time, excluding breaks, meetings, etc.
-
Record downtime events – Capture any downtime from equipment failures, changeovers, planned maintenance etc.
-
Track cycle times – Measure the actual time to complete each cycle and compare to the ideal cycle time.
-
Count quality defects – Record any units that require rework or are scrapped.
-
Calculate OEE – Use the above data to calculate OEE according to the standard formula.
Most manufacturers use some type of production monitoring system like a manufacturing execution system (MES) or IoT sensors to automatically capture OEE data. This makes the calculation process much smoother.
How to Improve OEE
The whole point of measuring OEE is to improve it. Here are some strategies manufacturers can use:
-
Prioritize availability – Focus on eliminating unplanned downtime through preventive maintenance, operator training, and root cause problem solving.
-
Optimize changeovers – Use SMED techniques to streamline changeover processes and reduce changeover time.
-
Increase performance – Address bottlenecks and implement operator training to achieve maximum rated speeds.
-
Improve quality – Apply quality management methods like mistake-proofing to reduce defects.
-
Implement autonomous maintenance – Empower operators to perform basic maintenance tasks to minimize downtime.
-
Adopt predictive maintenance – Use condition monitoring to detect issues and schedule maintenance in advance.
-
Foster continuous improvement culture – Engage teams through kaizen events, 5S, and other lean initiatives.
-
Leverage data analytics – Identify OEE drivers and patterns through statistical analysis and artificial intelligence.
-
Sustain improvements – Regularly review OEE and reinforce best practices through training and standard work.
The key is to make OEE improvement a never-ending pursuit. Even top-performing plants still have plenty of room to enhance their OEE.
Getting Started with OEE
Here are some tips for organizations just getting started with OEE:
-
Educate teams on OEE and its importance
-
Start measuring OEE for critical or bottleneck processes first
-
Focus on accurate data collection and calculation
-
Analyze results to identify and prioritize losses
-
Set an OEE baseline and improvement targets
-
Communicate OEE metrics on the shop floor
-
Celebrate OEE improvements and successes
The data and insights gained from OEE are invaluable. However, without a structured approach for acting on that data, plants will struggle to turn OEE into real performance gains. By putting in place the strategies outlined here, manufacturers can leverage OEE to drive increased productivity, efficiency, and profitability.
Overall Equipment Effectiveness is one of the most important metrics for measuring and improving manufacturing productivity. By quantifying OEE and its underlying losses, plants can zero in on problem areas, justify investments, optimize processes, and meet production demands. With the right initiatives, systems, and culture in place, manufacturers can break free of the average and achieve true manufacturing excellence. The first step is becoming educated on Overall Equipment Effectiveness and what it reveals about your operations.
Why the Preferred OEE Calculation?
OEE scores provide very valuable insight – an accurate picture of how effectively your manufacturing process is running. And it makes it easy to track improvements in that process over time.
What your OEE score doesn’t provide is any insights as to the underlying causes of lost productivity. This is the role of Availability, Performance, and Quality.
In the preferred calculation, you get the best of both worlds. A single number that captures how well you are doing (OEE) and three numbers that capture the fundamental nature of your losses (Availability, Performance, and Quality).
Here is an interesting example. Look at the following OEE data for two sequential weeks.
| OEE Factor | Week 1 | Week 2 |
|---|---|---|
| OEE | 85.1% | 85.7% |
| Availability | 90.0% | 95.0% |
| Performance | 95.0% | 95.0% |
| Quality | 99.5% | 95.0% |
OEE is improving. Great job! Or is it? Dig a little deeper, and the picture is less clear. Most companies would not want to increase Availability by 5.0% at the expense of decreasing Quality by 4.5%.
Now, let’s work through a complete example using the preferred OEE calculation. Here is the data recorded for the first shift:
| Item | Data |
|---|---|
| Shift Length | 8 hours (480 minutes) |
| Breaks | (2) 15 minutes and (1) 30 minutes |
| Downtime | 47 minutes |
| Ideal Cycle Time | 1.0 seconds |
| Total Count | 19,271 widgets |
| Reject Count | 423 widgets |
As described in the OEE Factors page, the OEE calculation begins with Planned Production Time. So first, exclude any Shift Time where there is no intention of running production (typically Breaks).
Formula: Shift Length − Breaks
Example: 480 minutes − 60 minutes = 420 minutes
The next step is to calculate the amount of time that production was actually running (was not stopped). Remember that Stop Time should include both Unplanned Stops (e.g., Breakdowns) or Planned Stops (e.g., Changeovers). Both provide opportunities for improvement.
Formula: Planned Production Time − Stop Time
Example: 420 minutes − 47 minutes = 373 minutes
If you do not directly track Good Count, it also needs to be calculated.
Formula: Total Count − Reject Count
Example: 19,271 widgets − 423 widgets = 18,848 widgets
Availability is the first of the three OEE factors to be calculated. It accounts for when the process is not running (both Unplanned Stops and Planned Stops).
Formula: Run Time / Planned Production Time
Example: 373 minutes / 420 minutes = 0.8881 (88.81%)
Performance is the second of the three OEE factors to be calculated. It accounts for when the process is running slower than its theoretical top speed (both Small Stops and Slow Cycles).
Formula: (Ideal Cycle Time × Total Count) / Run Time
Example: (1.0 seconds × 19,271 widgets) / (373 minutes × 60 seconds) = 0.8611 (86.11%)
Performance can also be calculated based on Ideal Run Rate. The equivalent Ideal Run Rate in our example is 60 parts per minute.
Formula: (Total Count / Run Time) / Ideal Run Rate
Example: (19,271 widgets / 373 minutes) / 60 parts per minute = 0.8611 (86.11%)
Quality is the third of the three OEE factors to be calculated. It accounts for manufactured parts that do not meet quality standards.
Formula: Good Count / Total Count
Example: 18,848 widgets / 19,271 widgets = 0.9780 (97.80%)
Finally, OEE is calculated by multiplying the three OEE factors.
Formula: Availability × Performance × Quality
Example: 0.8881 × 0.8611 × 0.9780 = 0.7479 (74.79%)
OEE can also be calculated using the simple calculation.
Formula: (Good Count × Ideal Cycle Time) / Planned Production Time
Example: (18,848 widgets × 1.0 seconds) / (420 minutes × 60 seconds) = 0.7479 (74.79%)
The result is the same in both cases. The OEE for this shift is 74.79%.
What is OEE and How To Calculate | Mastering Maintenance Overall Equipment Effectiveness
What is Overall Equipment Effectiveness (OEE)?
What is OEE? Overall equipment effectiveness (OEE) is a metric used to measure the effectiveness and performance of manufacturing processes or any individual piece of equipment. It provides insights into how well equipment is used and how efficiently it operates in producing goods or delivering services.
What is overall equipment effectiveness?
Overall Equipment Effectiveness is a crucial Key Performance Indicator in the manufacturing sector, offering insights into the efficiency and effectiveness of machinery and production lines.
How can equipment effectiveness be used as a measure of performance?
The key to utilizing overall equipment effectiveness as a measure of performance lies in being able to understand what it is, measuring OEE effectively and implementing changes and modifications to achieve continuous improvement. OEE is a commonly used key performance indicator, which calculates the percentage of truly productive time.
What is total effective equipment performance?
Total Effective Equipment Performance defines ‘available time’ as all time. In other words, 24 hours a day, 7 days a week. A TEEP score of 100% would mean that the production process never stopped day or night, 7 days a week, and without any short stops or slowdowns produced only good quality products.
