Learn how to calculate marginal revenue, why it is important for business, and what the real world application of this concept is.
For any business, properly analyzing and interpreting revenue metrics is crucial to maximizing profits and growth Two vitally important concepts in this area are total revenue and marginal revenue Though related, these terms capture different aspects of a company’s earnings.
Understanding the distinction between total revenue and marginal revenue, and knowing how to calculate and apply each, provides vital insights for sound business decisions and financial strategy.
In this comprehensive guide, we’ll explore the meaning and significance of total revenue and marginal revenue, including:
- Definitions and calculations
- The relationship between total and marginal revenue
- How each is graphed
- Usage in profit maximization
- Differences for competitive vs. monopoly firms
- Examples and applications
Grasping these key revenue concepts empowers organizations to better evaluate their earnings, costs, production levels, and pricing to optimize success.
Defining Total Revenue
Total revenue simply refers to the total amount of money a firm receives from sales of its products or services, during a given period of time. It is calculated by multiplying the quantity sold by the price per unit.
For example, if a company sells 500 units at $10 each, their total revenue is $5,000.
Total revenue provides a big-picture view of a company’s sales earnings before considering any costs or other expenses. It encompasses all revenue streams from all products or services.
Trends in total revenue over time give insight into growth, demand, and the impact of marketing campaigns or economic shifts. Total revenue sets the foundation for gauging profitability.
Understanding Marginal Revenue
While total revenue paints the full sales picture, marginal revenue offers a narrowed perspective on how revenue changes with incremental production.
Marginal revenue is the additional revenue gained from selling one more unit. So if a company sells 10 units for $100 each, recording $1,000 total revenue, but sells 11 units for $95 each, recording $1,045 total revenue, the marginal revenue of producing the 11th unit is $45.
Marginal revenue analyzes the impact of small boosts in output. It helps companies identify optimal production levels where creating one more good continues to increase revenue more than costs.
The Relationship Between Total and Marginal Revenue
Though distinct metrics, total revenue and marginal revenue share an important relationship.
-
Total revenue sets the revenue base from current production quantity. Marginal revenue measures incremental gains above that.
-
Changes in marginal revenue impact total revenue. Selling an additional unit at a positive marginal revenue increases total earnings.
-
But the reverse is not true – changes in total revenue do not directly shift marginal revenue, which isolates the revenue of the last unit sold.
-
Graphing revenue numbers visually shows the connection. Total revenue climbs as units increase. Marginal revenue fluctuates above and below average total revenue per unit.
Understanding this interplay helps businesses make smarter decisions about maximizing production, sales, and profits.
How Total Revenue Is Graphed
A company’s total revenue can be easily charted on a graph to depict the total revenue curve. Total revenue is displayed on the Y-axis. The quantity of goods sold is shown on the X-axis.
As production and sales levels rise, total revenue increases. But eventually, total revenue growth slows and plateaus due to the law of diminishing returns.
The total revenue curve illustrates these dynamics:
-
The curve slopes upward because producing and selling more goods leads to higher total revenues.
-
The upward slope decelerates at higher quantities as marginal revenue from additional units declines.
-
The curve may flatten out as revenues hit a ceiling, beyond which increased output does not increase revenue.
Analyzing the total revenue curve helps companies identify ideal output levels. The steepest part of the curve shows where revenue is rising fastest in relation to quantity.
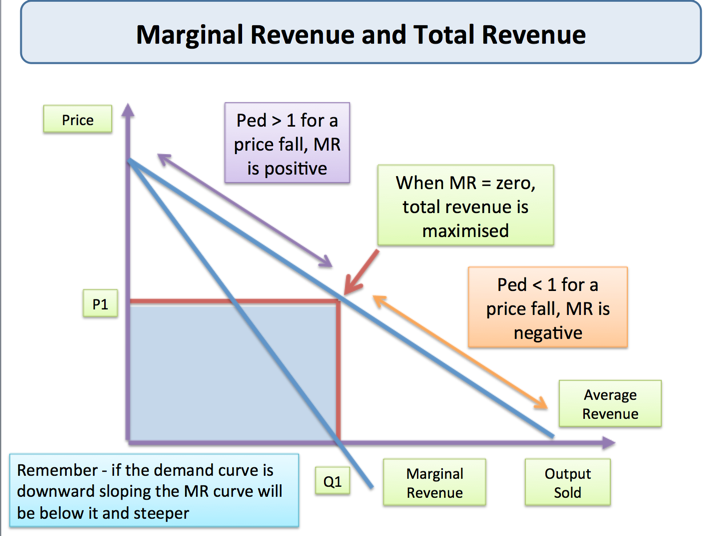
How Marginal Revenue Is Graphed
Since marginal revenue compares incremental differences in total revenue across units sold, the marginal revenue curve has a distinct flattened, downward shape:
-
It declines because each additional unit sold brings in less revenue than the prior unit. This reflects diminishing marginal returns.
-
As the company sells more, it must lower the product price to attract further sales. This pushes marginal revenue down.
-
The curve flattens out as marginal revenues stabilize around a reduced amount at higher quantities. Further sales only minimally increase total revenues.
This visual marginal revenue curve helps illustrate optimal output based on incremental revenue changes. The quantity where marginal revenue equals marginal cost is the most profitable production level.
Using Revenue Data to Maximize Profit
The interplay between total and marginal revenue has important implications for profit maximization:
-
Firms aim to produce at the output level where marginal revenue equals marginal cost. This maximizes the marginal profit per unit.
-
Beyond this intersection point, marginal cost exceeds marginal revenue so producing more goods reduces profitability.
-
Total profit is maximized at the output level just before marginal revenue sinks below marginal cost.
Regularly analyzing total revenue and marginal revenue trends informs strategic decisions about pricing, manufacturing, labor, marketing, and other factors that impact costs and revenues.
Comparing Competitive vs. Monopoly Firms
How total revenue and marginal revenue behave also differs based on the amount of competition a firm faces:
Competitive firms:
-
Tend to be price takers with no control over setting prices.
-
Marginal revenue equals price for every unit sold. Firms can sell any quantity at the market price.
-
Total revenue curve slopes up; marginal revenue curve is flat at the constant market price.
Monopolies:
-
Can set prices and influence demand through pricing power.
-
Marginal revenue is less than price because lowering prices is needed to sell more units.
-
Total revenue curve slopes up; marginal revenue curve slopes downward.
These distinctions demonstrate how market power impacts revenue patterns. Both competitive and monopoly firms maximize profit where marginal cost equals marginal revenue.
Total Revenue vs. Marginal Revenue Examples
Let’s look at some examples to illustrate calculating and applying total revenue and marginal revenue numbers:
Example 1
A bakery sells muffins for $5 each. In week 1, they sell 200 muffins for $1,000 total revenue. In week 2, they lower the price to $4.50 each and sell 300 muffins for $1,350 total revenue.
- Week 1 total revenue = $5 x 200 = $1,000
- Week 2 total revenue = $4.50 x 300 = $1,350
- Marginal revenue for the 300th unit sold = Change in total revenue / Change in quantity = ($1,350 – $1,000) / (300 – 200) = $350 / 100 = $3.50
This shows that cutting the price allowed the bakery to increase total revenue but decreased the marginal revenue per unit sold.
Example 2
A car dealership’s total revenue numbers across varying sales levels are:
- 10 cars sold: $400,000 total revenue
- 20 cars sold: $700,000 total revenue
- 30 cars sold: $900,000 total revenue
- 40 cars sold: $1,100,000 total revenue
The marginal revenue of the 20th unit sold is ($700,000 – $400,000) / (20 – 10) = $300,000.
The marginal revenue of the 30th unit sold is ($900,000 – $700,000) / (30 – 20) = $200,000.
This demonstrates the declining marginal revenue values as production increases.
Key Takeaways
-
Total revenue provides the full sales picture while marginal revenue offers narrowed insight on incremental gains.
-
Marginal revenue ultimately affects total revenue patterns.
-
Graphing revenue curves helps firms identify optimal output levels.
-
Analyzing marginal revenue versus marginal cost shows the most profitable production quantity.
-
Competitive and monopoly firms display different total revenue and marginal revenue behaviors.
-
Regularly calculating and interpreting revenue metrics aids strategic business decisions.
For any company, consistently monitoring reliable total and marginal revenue data provides tremendous value for pursuing growth and profitability. Mastering these foundational business concepts empowers organizations to confidently navigate pricing, output levels, expenses, and other decisions essential to financial success.
How to calculate marginal revenue
Marginal revenue equals the sale price of an additional item sold. To calculate the marginal revenue, a company divides the change in its total revenue by the change of its total output quantity. Marginal revenue is equal to the selling price of a single additional item that was sold.
Heres the marginal revenue formula: Marginal revenue = Change in revenue / Change in quantity
To calculate the revenue change, the company subtracts the revenue figure achieved before the sale of the last unit from the total revenue received after the sale.
You can use the above marginal revenue formula to measure any production level change. Typically, businesses use it to measure the change in the production of an additional unit, so the denominator generally is one (1).
Marginal revenue vs. marginal cost
Marginal revenue refers to the money a company makes from each additional sale, while marginal cost is the amount it costs the company to produce extra units. When marginal revenue is higher than a firms marginal cost, then it is making money.
When marginal costs equal marginal revenue, then the firm enjoys profit maximization. Past this point, the company cannot make any more profit since any additional production costs more.
