Do you have your dataset stored in Excel and you’re thinking what if the XYZ number was something else?
Well, if that’s the case, don’t just keep thinking. Create a scenario, change it and see how your data changes shape. How?
Oh, I will walk you through that in the guide below. Just stay tuned and make sure to download the free sample workbook for this guide here to tag along with the guide
As an Excel user, you must be familiar with tweaking cell values to model different outcomes But changing cells manually can be tedious for large models
This is where Scenario Manager comes into play. It allows you to save different versions of your spreadsheet, switch between them instantly, and visualize the outcomes.
In this comprehensive guide, you’ll learn how to use Scenario Manager in Excel to effortlessly manage different data scenarios.
What is Scenario Manager in Excel?
Scenario Manager is an Excel tool to create and quickly switch between different versions of a spreadsheet.
For example you may have a complex financial model and want to see results for
- Best case
- Worst case
- Most likely case
Instead of manually changing multiple cells, you can use Scenario Manager to save these as scenarios. Then switch between them with a single click!
Key features of Scenario Manager:
- Save multiple data scenarios
- Instantly switch between scenarios
- Visualize scenario outcomes together
- Compare scenarios to identify trends
This enables robust what-if analysis and simplifies sensitivity testing in your models. Now let’s see how to use it.
How to Create Scenarios in Excel
Follow these steps to create scenarios in Excel:
1. Enter Your Model Data
Build your base spreadsheet model first. This could be anything from a simple expenses table to a large financial forecast.
2. Select Scenario Input Cells
These are cells that you want to change between scenarios. For example, sales amounts, tax rates, cost figures, etc.
3. Go to Data > What-If Analysis > Scenario Manager
This opens the Scenario Manager dialog box.
4. Click Add
Give the scenario a name like “Best Case”, “Worst Case” etc.
5. Enter Values for the Input Cells
Fill the input cells with values you want for this scenario. Leave others blank.
6. Click OK
The scenario is saved and will reflect in the summary on top.
7. Repeat to Add Scenarios
Go through steps 4-6 above to add more scenarios as needed.
That’s it! Now you can switch between the saved scenarios and instantly view different model outcomes.
Scenario Manager Example in Excel
Let’s see an example to understand this better:
![Scenario Manager Example][]
In this revenue forecast model:
- B5:B8 are the input cells – unit price, units sold, fixed costs, variable costs
- Row 12 shows the forecast revenue based on input cells
We create three scenarios:
- Best Case – High price, high sales, low costs
- Worst Case – Low price, low sales, high costs
- Most Likely – Moderate assumptions
Steps:
- Build model
- Select input cells B5:B8
- Go to Scenario Manager
- Add scenarios (Best, Worst, Most Likely)
- Input values for B5:B8 in each case
- Click OK
Now we can instantly view the revenue in each scenario!
Scenario Manager Features in Excel
Here are some useful things you can do with scenarios:
Switch Scenarios – Select any scenario from the dropdown on top to view its data.
Edit Scenarios – Click the Edit button to change values in a scenario.
Merge Scenarios – Combine two scenarios into one. Useful for sensitivity testing.
Delete Scenarios – Remove any unwanted scenarios.
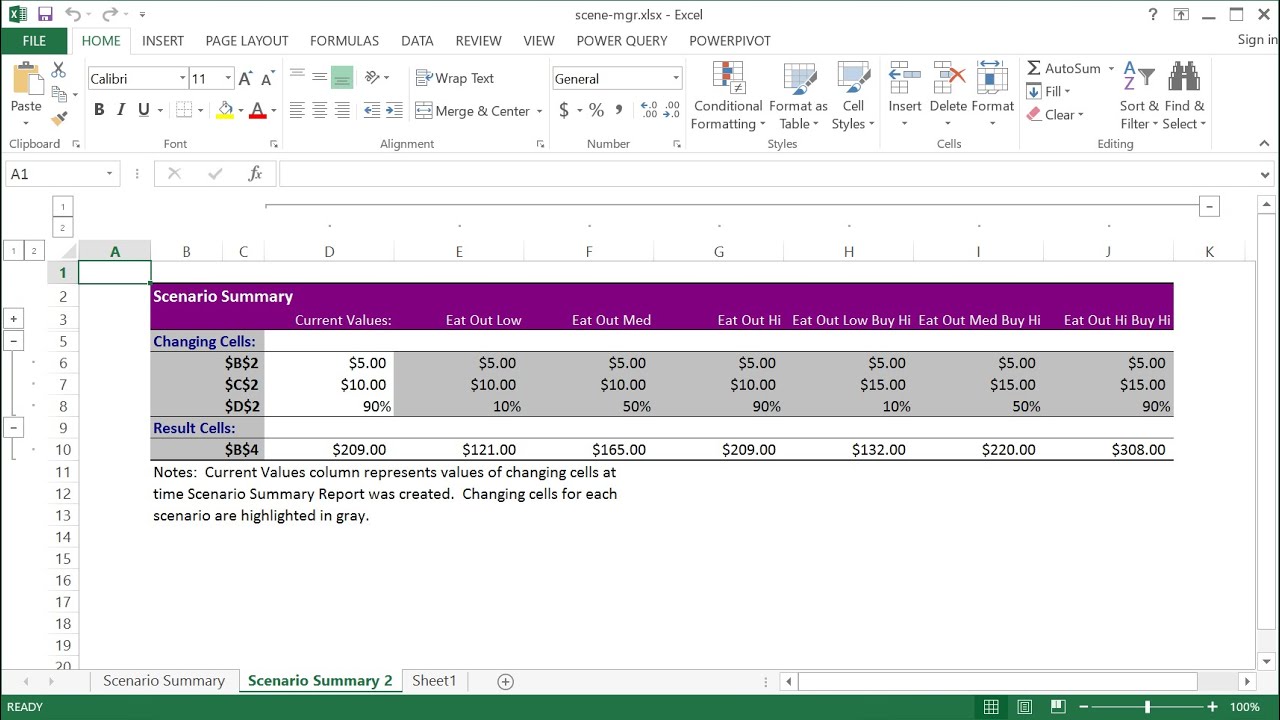
Generate Report – Creates a report comparing input values and outcomes of scenarios.
View Outcomes Together – Check ‘Show’ to see scenario outcomes side-by-side.
Protect Sheet – Lock the sheet and optionally the scenarios to prevent accidental changes.
Scenario Manager Use Cases
Here are some examples of how Scenario Manager is used for analysis:
Budgeting and Forecasting – Model best, worst and expected case assumptions.
Sensitivity Analysis – See how outcomes vary for different variables.
Simulations – Test model robustness across wide range of inputs.
Presentations – Switch between scenario views during presentations.
Goal Seeking – Understand target inputs needed to achieve specific outcomes.
Decision Analysis – Compare scenarios to determine optimal business strategy.
Impact Assessment – Quantify risks and opportunities for different situations.
Audits – Test model integrity by stress testing assumptions.
The possibilities are truly endless with Scenario Manager!
Scenario Manager Limitations
Despite being an extremely useful tool, Scenario Manager does have some limitations:
- Max. 32 scenarios per workbook
- Scenarios need manual updating if model structure changes
- Limited flexibility in summarizing scenario differences
- Cannot link scenarios across multiple workbooks
- Cell formatting not managed by Scenario Manager
- Limited ability to automate scenario creation and analysis
For advanced requirements, you may need complex VBA code or an Excel add-in. But Scenario Manager covers fundamental scenario modeling needs for most users.
Scenario Manager Best Practices
Here are some tips to use Scenario Manager effectively:
- Keep fewer key input cells for clarity
- Build scenarios from smallest variances to largest
- Name scenarios intuitively for easy selection
- Stress test extreme cases to check model validity
- Update scenarios whenever source data changes
- Review reports before finalizing decisions
- Protect sheet and scenarios to prevent errors
- Document methodology and limitations
Scenario Manager is an incredibly useful tool for conducting what-if analysis in Excel. It saves the effort of manually changing input values and instantly allows viewing alternative outcomes.
With just a few clicks, you can create and manage multiple scenarios for effective forecasting, projections, simulations and decision analysis.
What is the scenario manager in Excel?
The Excel scenario manager is one of the many data analysis tools available in Excel. It comes as a part of the three-in-one what-if-analysis tools of Excel (that are in-built into Excel).
Using it, you can evaluate multiple ranges of input values to see how they affect one output value. That means you can perform a scenario test
You can make different scenarios (good, bad, worst, excellent, etc.). Feed input values for each of them and see how the results change for each of these scenarios.
You can alter the values for up to 32 input values using the Scenario Manager. Believe me, it sounds much more fun to see this in action. And we will see that just shortly.
When to use the scenario manager
You can use the Scenario Manager in Excel when you want to
- Manipulate your data for different changes.
- Preserve each scenario and compare it.
- Get a summary report for all the scenarios defined.
- Merge scenarios from multiple worksheets and workbooks.
How to use the Scenario manager in Excel
How to create a scenario in Excel?
Step 1: First, go to the Data tab. Click on the What-If Analysis Excel drop-down list and select Scenario Manager … Step 2: The Scenario Manager window appears. Click on the Add button. Step 3: Then, in the Add Scenario window, we can name the scenarios in the Scenario name: box. In our example, let us name the first scenario as Scenario 1.
What is a scenario manager?
The Scenario Manager creates a summary of all the scenarios and give the user the best chance to compare and make decisions. If you want to learn Excel and VBA professionally, then Excel VBA All in One Courses Bundle (35+ hours) is the perfect solution.
How to add a scenario manager?
As a result, a Scenario Manager dialogue box will appear in front of you. From the dialog box, click on Add option. In the prompted Add Scenario dialogue box, fill in the required details. Enter a name ( Worst Case) for the Scenario name Add any comment that you wish to into the Comment box. Or you can also leave it blank.
What is a scenario manager in Excel?
With the Scenario Manager in Microsoft Excel, you can enter values for each different situation, save them, and then switch between them with a click. This can help you forecast finances or make a decision based on the results of the Scenario Manager. For the best way to show how useful the tool can be, let’s walk through an example.
