The debt-to-equity (D/E) ratio is an important financial metric that compares a company’s total liabilities to its shareholder equity. This ratio gives investors an idea of how much debt a company is using to finance its operations and growth, and whether its reliance on debt is sustainable long-term.
But what exactly constitutes a “good” debt-to-equity ratio? The answer depends on various factors. In this article, we’ll explore what the D/E ratio tells us, what an ideal range looks like, and when a high or low ratio could signal risks or opportunities.
What the Debt-to-Equity Ratio Measures
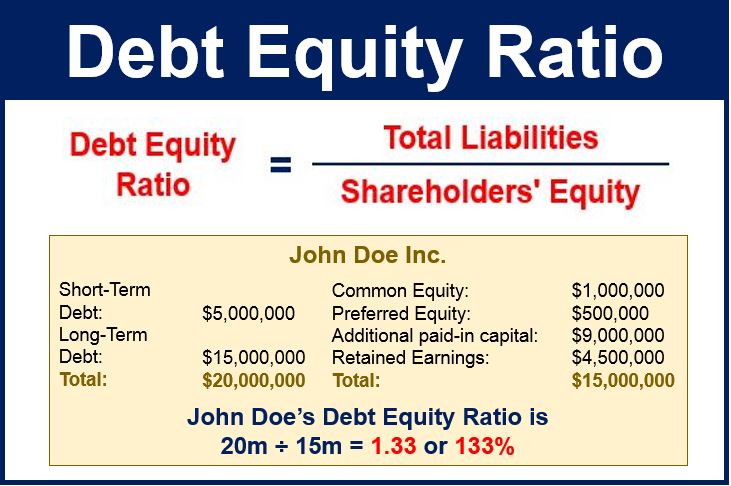
The D/E ratio is calculated by dividing a company’s total liabilities by its shareholder equity. These figures are available on a company’s balance sheet.
A higher D/E ratio generally indicates higher financial risk. It means the company is relying heavily on debt financing rather than its own equity. This can make it more difficult for the company to pay interest and principal on loans if business conditions deteriorate.
On the other hand, a lower D/E ratio indicates the company is using relatively little debt compared to equity to finance itself. This provides a cushion in case profitability declines temporarily. Too low of a D/E ratio may indicate the company is not optimizing its use of debt to grow the business.
What is Considered a Good Range?
As a general guideline, a D/E ratio below 1.0 is considered relatively safe while ratios of 2.0 or higher are seen as risky. However, these thresholds can vary significantly by industry.
For example, utility companies often carry a high D/E ratio because they require huge investments in infrastructure funded by debt. The stable revenue in this industry offsets the risks of high leverage
Banks also tend to have higher D/E ratios, with the average ratio for large banks being around 10x. Financial companies rely on lending and deposits to fund operations, naturally leading to higher leverage.
On the other end, young technology firms often have little or no debt. Their D/E ratios are very low as they rely on venture capital and equity financing in the early growth stages.
To evaluate a company’s capital structure, it’s best to compare its ratio with close competitors and observe how it changes over time. Sudden increases could signal added risk, while a decrease suggests less reliance on debt financing.
When a High Ratio Could be a Red Flag
A high and rapidly rising D/E ratio should prompt further investigation, even if it’s in line with industry averages. Here are some specific situations where an elevated ratio could spell trouble:
-
The company is aggressively pursuing growth by borrowing heavily. Debt-fueled growth isn’t necessarily bad, but it’s risky if interest expenses start exceeding the returns on that investment.
-
The borrowing is being used to fund risky projects with uncertain outcomes. Debt loads can quickly become unmanageable if projects don’t generate expected cash flows.
-
Interest rates are rising, making existing variable rate debt obligations more expensive. Companies with a lot of leverage suffer greater impact when rates rise.
-
The company already has a suboptimal credit rating. Additional borrowing could further impair creditworthiness and raise borrowing costs.
-
Major competitors carry significantly less leverage. This could signal the company is overextending itself to keep up in a difficult business climate.
If these warning signs are present, investors should take a closer look at the company’s overall profitability, cash flow generation, and credit quality trends before jumping aboard.
When a Low Ratio Could Indicate Missed Opportunities
On the other hand, a very low D/E ratio below the industry average could suggest:
-
The company is leaving profitable growth opportunities on the table by not using sufficient debt financing. This overly conservative strategy leads to slower growth.
-
The balance sheet has excess unused borrowing capacity. Taking on more leverage could benefit shareholders if deployed wisely.
-
The company generates ample free cash flow it could leverage to fund growth or acquisitions. Conservative policies result in idle cash.
-
Access to low-cost borrowing isn’t being fully utilized. Reluctance to issue debt results in higher cost of capital than necessary.
-
Management lacks confidence in the business to take on expansion risks. This points to deeper issues with strategy or execution.
A low and declining D/E ratio trend doesn’t necessarily mean investors should avoid these stocks. But it may indicate suboptimal financial policies that could change under new management or improved business prospects.
Industry and Business Life Cycle Considerations
As we’ve seen, an ideal D/E ratio range differs vastly across industries. Capital-intensive sectors like utilities and telecoms can efficiently operate with very high leverage. Growth companies like tech firms use little or no debt initially.
The life cycle stage also heavily influences optimal capital structure. Startups and other high-growth companies rely on equity to establish themselves before taking on debt. Mature companies in slower-growth mature industries use more leverage to optimize returns.
Here are some general observations on leverage trends across industries and life cycles:
-
Early stage companies – Low leverage as equity financing dominates. Debt capacity is limited.
-
High growth companies – Leverage rises as debt is used to expand quickly. Balance sheets remain flexible.
-
Mature companies – Higher leverage as growth slows. Debt servicing is supported by stable cash flows.
-
Declining companies – Dangerously high leverage as borrowing fuels unprofitable diversification.
While the D/E ratio provides a useful snapshot of leverage, it should be interpreted in the appropriate industry and business life cycle context.
Using Long-Term Debt Ratios
Since long-term debt obligations are generally riskier for companies, some analysts calculate D/E ratios using only long-term debt rather than total liabilities. This provides a picture of how leverage might impact the business over the long run.
Similarly, investors may look at trends in the long-term debt/equity ratio to identify situations like:
-
Long-term leverage building steadily over time
-
Spikes in long-term borrowing to fund major expansions
-
Declining long-term debt as company maturity leads to deleveraging
Though not as commonly cited as the standard D/E ratio, long-term debt ratios provide additional insight on how companies use leverage.
Total Liabilities Distortions
While easy to calculate using balance sheet data, the D/E ratio can be distorted by nuances in what constitutes debt and equity. Some examples include:
-
Operating leases – These are not technically debt but represent fixed obligations.
-
Pension shortfalls – Create hidden additional liabilities.
-
Preferred equity – Blurs the line between debt and equity.
-
Intangible assets – Can artificially inflate book value equity.
To compensate, investors might strip out questionable assets/liabilities and use a tangible common equity ratio for a more accurate picture. The complexity of balance sheets underscores the need to supplement standard ratios with deeper analysis.
Using Cash Flow to Evaluate Leverage
Since balance sheets only show snapshots in time, looking at cash flows can provide a more dynamic view of how borrowing impacts finances. Important metrics include:
-
Operating cash flow – Measures ability to cover normal business expenses and debt costs. Declining operating cash is a red flag.
-
Free cash flow – Indicates capital available for debt reduction, dividends, share buybacks.
-
Cash flow coverage ratios – Compare cash generation to existing debt obligations.
Cash flow analysis provides a real-world stress test of whether current leverage levels are sustainable. Even companies with conservative D/E ratios could face problems if cash flows tighten.
The D/E Ratio for Personal Finance
While mainly used to analyze corporate leverage, D/E ratios can also provide insight into personal financial health. The same general principle applies: too much debt compared to equity exposes individuals to unwelcome surprises.
For personal finance, equity equates to assets minus liabilities. Any negative equity means liabilities exceed assets and spells financial distress. Generally, individuals should target a D/E ratio well below 1.
Of course, the “right” personal leverage depends on various factors like income stability, stage of life, and attitude toward risk. But tracking a personal D/E ratio over time can help identify if debt use is getting ahead of asset accumulation.
The debt-to-equity ratio is a useful starting point for assessing a company’s leverage. But wise investors don’t stop there. The D/E ratio should be:
- Compared to industry and life cycle norms
- Checked for distortions in debt/equity definitions
- Evaluated in light of cash flow trends
- Assessed in the context of business strategy and conditions
Like any single metric, the D/E ratio has limitations. It mainly serves as a preliminary gauge of financial risk and whether leverage is in line with broader expectations. An unexpected or unusual ratio prompts further enquiry to understand if capital structure aligns with business fundamentals.
Used properly, D/E ratios help investors spot companies potentially taking on excessive debt. But even more importantly, they highlight situations where prudent use of leverage could unlock value for shareholders. By balancing risks and opportunities, companies can
What Is a Good Debt-to-Equity (D/E) Ratio?
What counts as a “good” debt-to-equity (D/E) ratio will depend on the nature of the business and its industry. Generally speaking, a D/E ratio below 1 would be seen as relatively safe, whereas values of 2 or higher might be considered risky. Companies in some industries, such as utilities, consumer staples, and banking, typically have relatively high D/E ratios.
Note that a particularly low D/E ratio may be a negative, suggesting that the company is not taking advantage of debt financing and its tax advantages. (Business interest expense is usually tax deductible, while dividend payments are subject to corporate and personal income tax.)
What Does a Negative D/E Ratio Signal?
If a company has a negative D/E ratio, this means that it has negative shareholder equity. In other words, the company’s liabilities exceed its assets. In most cases, this would be considered a sign of high risk and an incentive to seek bankruptcy protection.
Debt To Equity Ratio Explained
How do you calculate debt-to-equity ratio?
To calculate it, you divide the company’s total liabilities by total shareholder equity, like so: Investors can use the D/E ratio as a risk assessment tool since a higher D/E ratio means a company relies more on debt to keep going. Below is an overview of the debt-to-equity ratio, including how to calculate and use it.
What is debt to equity ratio (D/E)?
Debt to Equity Ratio (D/E) measures financial risk by comparing the total debt obligations to the shareholders equity account.
What is a good debt-to-equity ratio?
The debt-to-equity ratio is calculated by dividing a corporation’s total liabilities by its shareholder equity. The optimal D/E ratio varies by industry, but it should not be above a level of 2.0. A D/E ratio of 2 indicates the company derives two-thirds of its capital financing from debt and one-third from shareholder equity.
What is an example of a debt-to-equity ratio?
For an example of a debt-to-equity ratio, let’s assume a company’s balance sheet shows that total liabilities are $100 million and that shareholders’ equity is $125 million. The company’s D/E ratio would be 0.8x in this case:
