If youre looking for a fast way to add an org chart to Powerpoint presentations, youve come to the right place. In this step-by-step guide, youll learn how to build, edit, and personalize the format of your org chart.
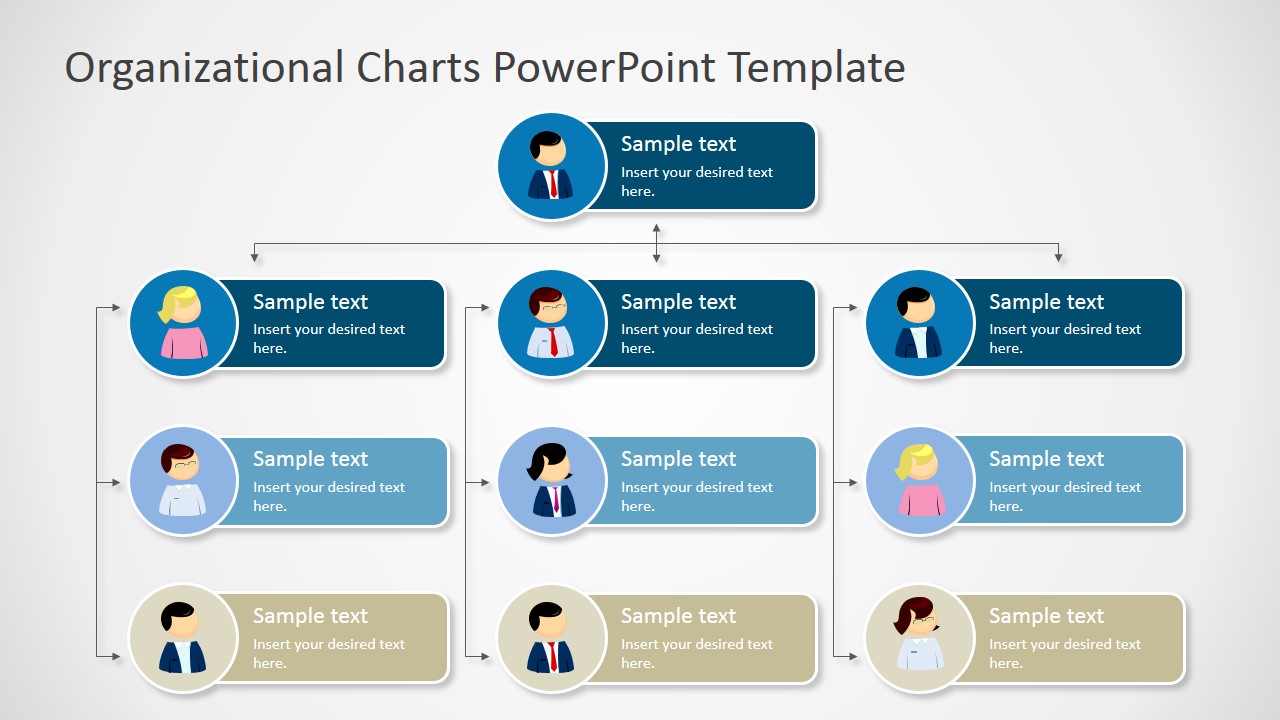
Organizational charts are a fantastic way to visualize company structures, team workflows and family connections. With SmartArt in Microsoft PowerPoint, anyone can easily create elegant and informative org charts.
In this comprehensive guide, I’ll walk you through how to build professional-looking organizational charts using PowerPoint’s tools. Whether you need a basic org chart, multi-level diagrams, or visually engaging layouts, these tips will help you master organization chart creation
Let’s dive in to making beautiful org charts in PowerPoint!
Select a SmartArt Org Chart Template
The fastest way to create an org chart in PowerPoint is starting with a pre-made template. Here’s how:
-
Open PowerPoint and navigate to the “Insert” tab.
-
Click the “SmartArt” button in the Illustrations section.
-
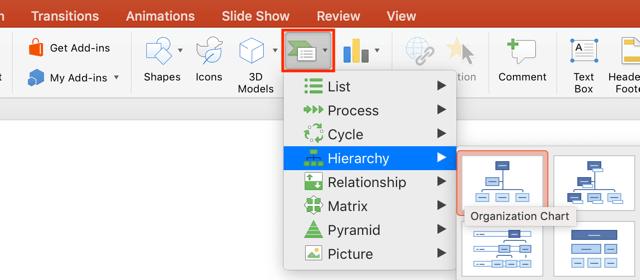
In the Choose a SmartArt Graphic window, select the “Hierarchy” category.
-
Browse the org chart layouts and choose one you like. Consider number of levels needed and visual impact.
-
Click “OK” to insert your selected template onto the slide.
With the template inserted, you can now customize it by adding your own text, formatting, and design. Let’s look at easy ways to tailor the chart to your needs.
Replace Placeholder Text with Your Information
The template you chose contains generic placeholder text. Swap this out for your real organizational info:
-
Click inside a shape and type over the text to replace it.
-
Press “Delete” to clear any unneeded placeholder text before typing.
-
Repeat for each shape, entering your real names, roles, departments, etc.
-
Use the text pane if you prefer typing there rather than directly on the chart.
Work systematically from top to bottom and left to right. Stick to concise titles for best fit.
Insert New Shapes For Additional Boxes
Need to add more boxes to contain more names? No problem:
-
Click the shape closest to where you want the new shape added.
-
Go to the “Design” tab and select “Add Shape” in the Create Graphic group.
-
A new shape will appear. Drag it into position if needed.
-
Type the name/info into the new shape.
Repeat as needed until everyone is represented! Inserting shapes is a quick and easy process.
Change the Chart Layout for Better Structure
The initial layout might not perfectly fit your organizational structure. Luckily, you can easily change it:
-
On the “Design” tab, use the Layouts section to pick a new structure.
-
Consider org chart direction – top to bottom, left to right, or radial.
-
Try variants like org charts with photos or custom background.
-
Rearrange and relevel shapes as needed after changing layouts.
Don’t be afraid to experiment with different layouts until you find the optimal org chart design.
Modify Formatting for a Unique Look
Make the org chart visually appeal to your audience by formatting it with custom styles and colors:
-
On the “Design” tab, pick one of the SmartArt Styles to change the color scheme.
-
For more control, select “Change Colors” to manually set fills and lines.
-
Use Shape Styles on the “Format” tab to alter shape outlines and effects.
-
Adjust text font, size, color, and more using WordArt Styles.
-
Match company branding for a professional edge.
Take time to get creative with formatting options until your org chart aligns with your vision!
Arrange Shapes and Connectors
The arrangement of shapes and connection lines can be adjusted to optimize flow:
-
Use the “Arrange” section on the “Format” tab to bring shapes forward and back.
-
Reroute connectors and reorder node hierarchy with Arrange tools.
-
Align shapes properly and evenly distribute space between them.
-
Resize shapes as needed to allow text to fit naturally.
Don’t settle for the default layout. Finesse the alignment of shapes and connectors for clarity.
Build More Complex Org Charts
Start simple, then expand your org chart into more intricate diagrams:
-
Insert new top-level boxes to divide chart by department, location, etc.
-
Add assistant shapes next to titles. Great for shared responsibilities.
-
Show hierachy with Org Chart Assistant shapes. Useful for managers overseeing subgroups.
-
Use secondary branch charts flowing from main boxes to illustrate divisions.
-
Link separate org charts on individual slides to create interconnected multipage charts.
Thorough planning lets you scale up basic charts into multidimensional masterpieces.
Import Data from Excel Spreadsheets
Manually populating complex org charts gets tedious. Use Excel integration to automate it:
-
Create an Excel table with columns: Name, Title, Manager, etc.
-
Select the data and hit “Ctrl + C” to copy it.
-
In PowerPoint, paste the clipboard contents (Ctrl + V) into a blank slide.
-
When prompted, pick “Create Organizational Chart” to convert the data into a SmartArt chart.
-
Customize and rearrange as needed.
This copies Excel data into an org chart in just seconds! You can also paste data into existing charts.
Use Photos and Graphics for Visual Impact
Plain shapes are functional but dull. Punch up the visual appeal of your org chart using multimedia:
-
Add photos inside shapes rather than just names. Makes charts more engaging.
-
Fill shapes with illustrations representing departments or roles.
-
Use graphics-rich PowerPoint themes with photos and textures.
-
Experiment with shape fill effects like gradients, patterns, and picture backgrounds.
-
Include relevant icons from icon libraries to liven things up.
Imagery makes org charts more memorable and appealing, especially for public facing charts.
Animate Build Steps for More Polish
Animation can showcase the hierarchy and organization:
-
On the “Animations” tab, use Entrance effects like Fade to make shapes slide in by order or level.
-
Add short delays between animations for a cascade building reveal.
-
Use Emphasis effects sparingly to highlight key executives.
-
Animations draw attention and make content more dynamic. But don’t overdo it.
-
Only animate after finalizing layout to avoid reworking steps.
Well-placed animations enliven presentations and focus the audience on key ideas incrementally.
Export for Other Uses
Don’t limit your PowerPoint org chart toslides. Repurpose it in other ways:
-
Export org charts as images to publish online or print as posters.
-
Copy and paste into Word documents as embedded objects.
-
Save individual portions as images to include in emails or reports.
-
Print handouts with org charts for employees to reference.
-
Share PowerPoint slides with org charts via online document sharing platforms.
With a PowerPoint org chart file, you can easily extract and distribute portions for maximal utility across contexts!
Learn Shortcuts to Construct Charts Faster
Mastering a few handy shortcuts speeds up org chart building immensely:
-
Ctrl + D duplicates selected shapes quickly. Great for departments with shared sub-roles.
-
Arrow Keys move shapes gradually for precise layouts.
-
Alt + ↑ ↓ adjusts height of selected shapes in live previews.
-
Alt + ← → adjusts width of shapes.
-
Alt + Rotate Handle freely rotates shapes.
Learn the many efficency-boosting shortcuts PowerPoint offers for fast org chart creation and refinement.
Now you have an in-depth guide to crafting stunning organizational charts in PowerPoint. From basic single-layer charts to intricate visualized hierarchies, the PowerPoint SmartArt tools provide everything you need for professional org charts.
Use these tips to create clear company structures, team workflows, family trees, and any other structured graphics. With a well-planned layout and polished visual design, your org charts will inform and impress.
How to Create an Organizational Chart in Powerpoint
- Add hierarchy SmartArt Click the Insert option in the top ribbon, then click the SmartArt button. Scroll down to the Hierarchy option, then click the first option, Organizational Chart.
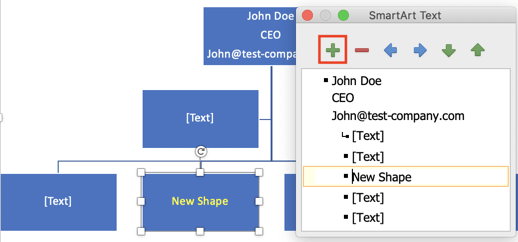
- Add employee descriptions To add or edit employee descriptions within the org chart shapes, click the shape and start typing or edit the contents in the SmartArt text box.

- Add shapes to org chart To add shapes or employees to the org chart, click the plus icon in the SmartArt text box. You can position the new shape under their manager by demoting them with the right arrow button. You can also right click (or control + click) on the shape, scroll down to the Add Shape option, then choose where youd like to place the new employee.
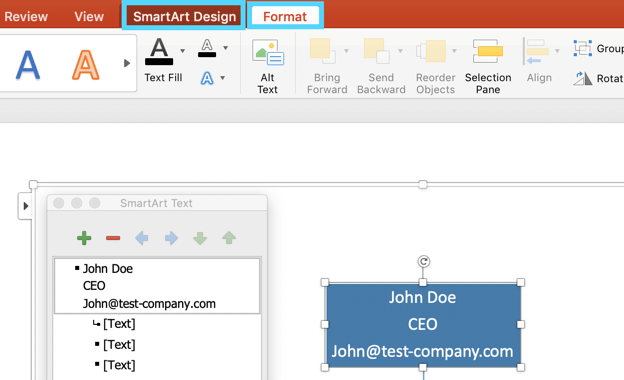
- Format org chart If you want to change the styling of your org chart, click the SmartArt Design tab in the top ribbon. In this section, you can make your org chart 3D, change the color scheme, or change the layout of your company’s structure. If you want to change the size of your org chart, give your text a WordArt style, give your shapes a colored outline, or many other formatting updates, click the Format tab in the top ribbon.
Create an org chart that updates automatically
Creating an Org Chart in PowerPoint with Templated Information
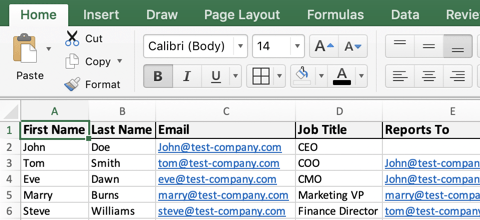
- Download the organizational chart template for Excel This file will contain all of the common data points found in org charts. You will be able to quickly add your staff info to this template and edit the information displayed in your org chart.
- Add employees to the org chart template Add data points for employees like first name, last name, and title. This org chart template can serve as the master document for your employee database.
- Copy/paste employee data into the org chart Copy all of the data you’d like to display in your org chart, then clear the information in the SmartArt text box and paste in your employee data. If there’s data in the employee database that you don’t want, you can hide columns before copying the data; this will exclude any unwanted employee data points.
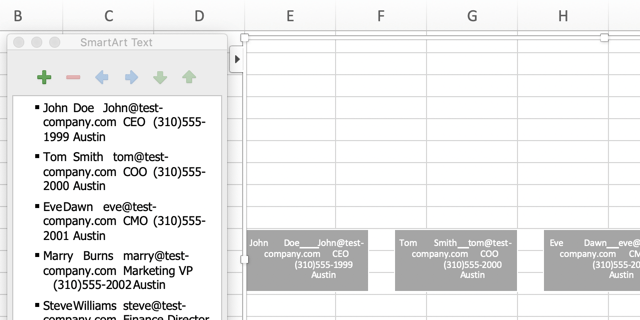
- Style employee data in the org chart The information copied over from the org chart template will be in one long line. Click into each shape where the employee data was pasted and organize the information into separate lines. To get your organizational structure to line up like the example below, start with the employee on the far right—or the most junior employee—and demote people until theyre under their manager

Create Organization Chart in 2 Minutes | Power Point Tutorials
How do I create an org chart in PowerPoint?
In PowerPoint, on the File tab, click New. In the Search for online templates and themes box, type org chart, and then click . Choose an org chart from the search results. Many aspects of the chart can be customized, so don’t hesitate to pick one just because of its color or layout. Click Create.
How do I create an organization chart?
Let’s get started. Head to the “Insert” tab and then click “SmartArt.” In the Choose a SmartArt Graphic window that opens choose the “Hierarchy” category on the left. On the right, click an organization chart layout, such as “Organization Chart.” When you’re done, click “OK.” Click a box in the SmartArt graphic, and then type your text.
Is there a PowerPoint template for org charts?
In Elements’ lineup, there’s truly a PowerPoint template for everything. You can create org charts in PowerPoint with the help of these templates. Use these templates instead of starting from a blank slate to save the time involved with designing slides. The advantage of Elements is that it’s a flat-rate service.
Why do you need an organizational chart in PowerPoint?
Be it for a pitch deck, project proposal, or business presentation, organizational charts are extremely useful to help understand hierarchy and the relationship between the different entities. With PowerPoint, there are two ways to create an organizational chart.
