Financial ratios are powerful tools used by investors, creditors, and internal management to analyze and compare companies across industries. By looking at simple metrics from a company’s financial statements – balance sheet, income statement, and cash flow statement – you can gain valuable insights into liquidity, leverage, operational efficiency, profitability, and valuation
In this comprehensive guide, we will cover the following topics:
- What are financial ratios and why are they useful?
- Major categories of financial ratios
- Liquidity ratios and what they measure
- Leverage ratios and what they assess
- Efficiency ratios and what they evaluate
- Profitability ratios and what they calculate
- Market value ratios and what they determine
- How to interpret and compare financial ratios
- Limitations of ratio analysis
What are Financial Ratios?
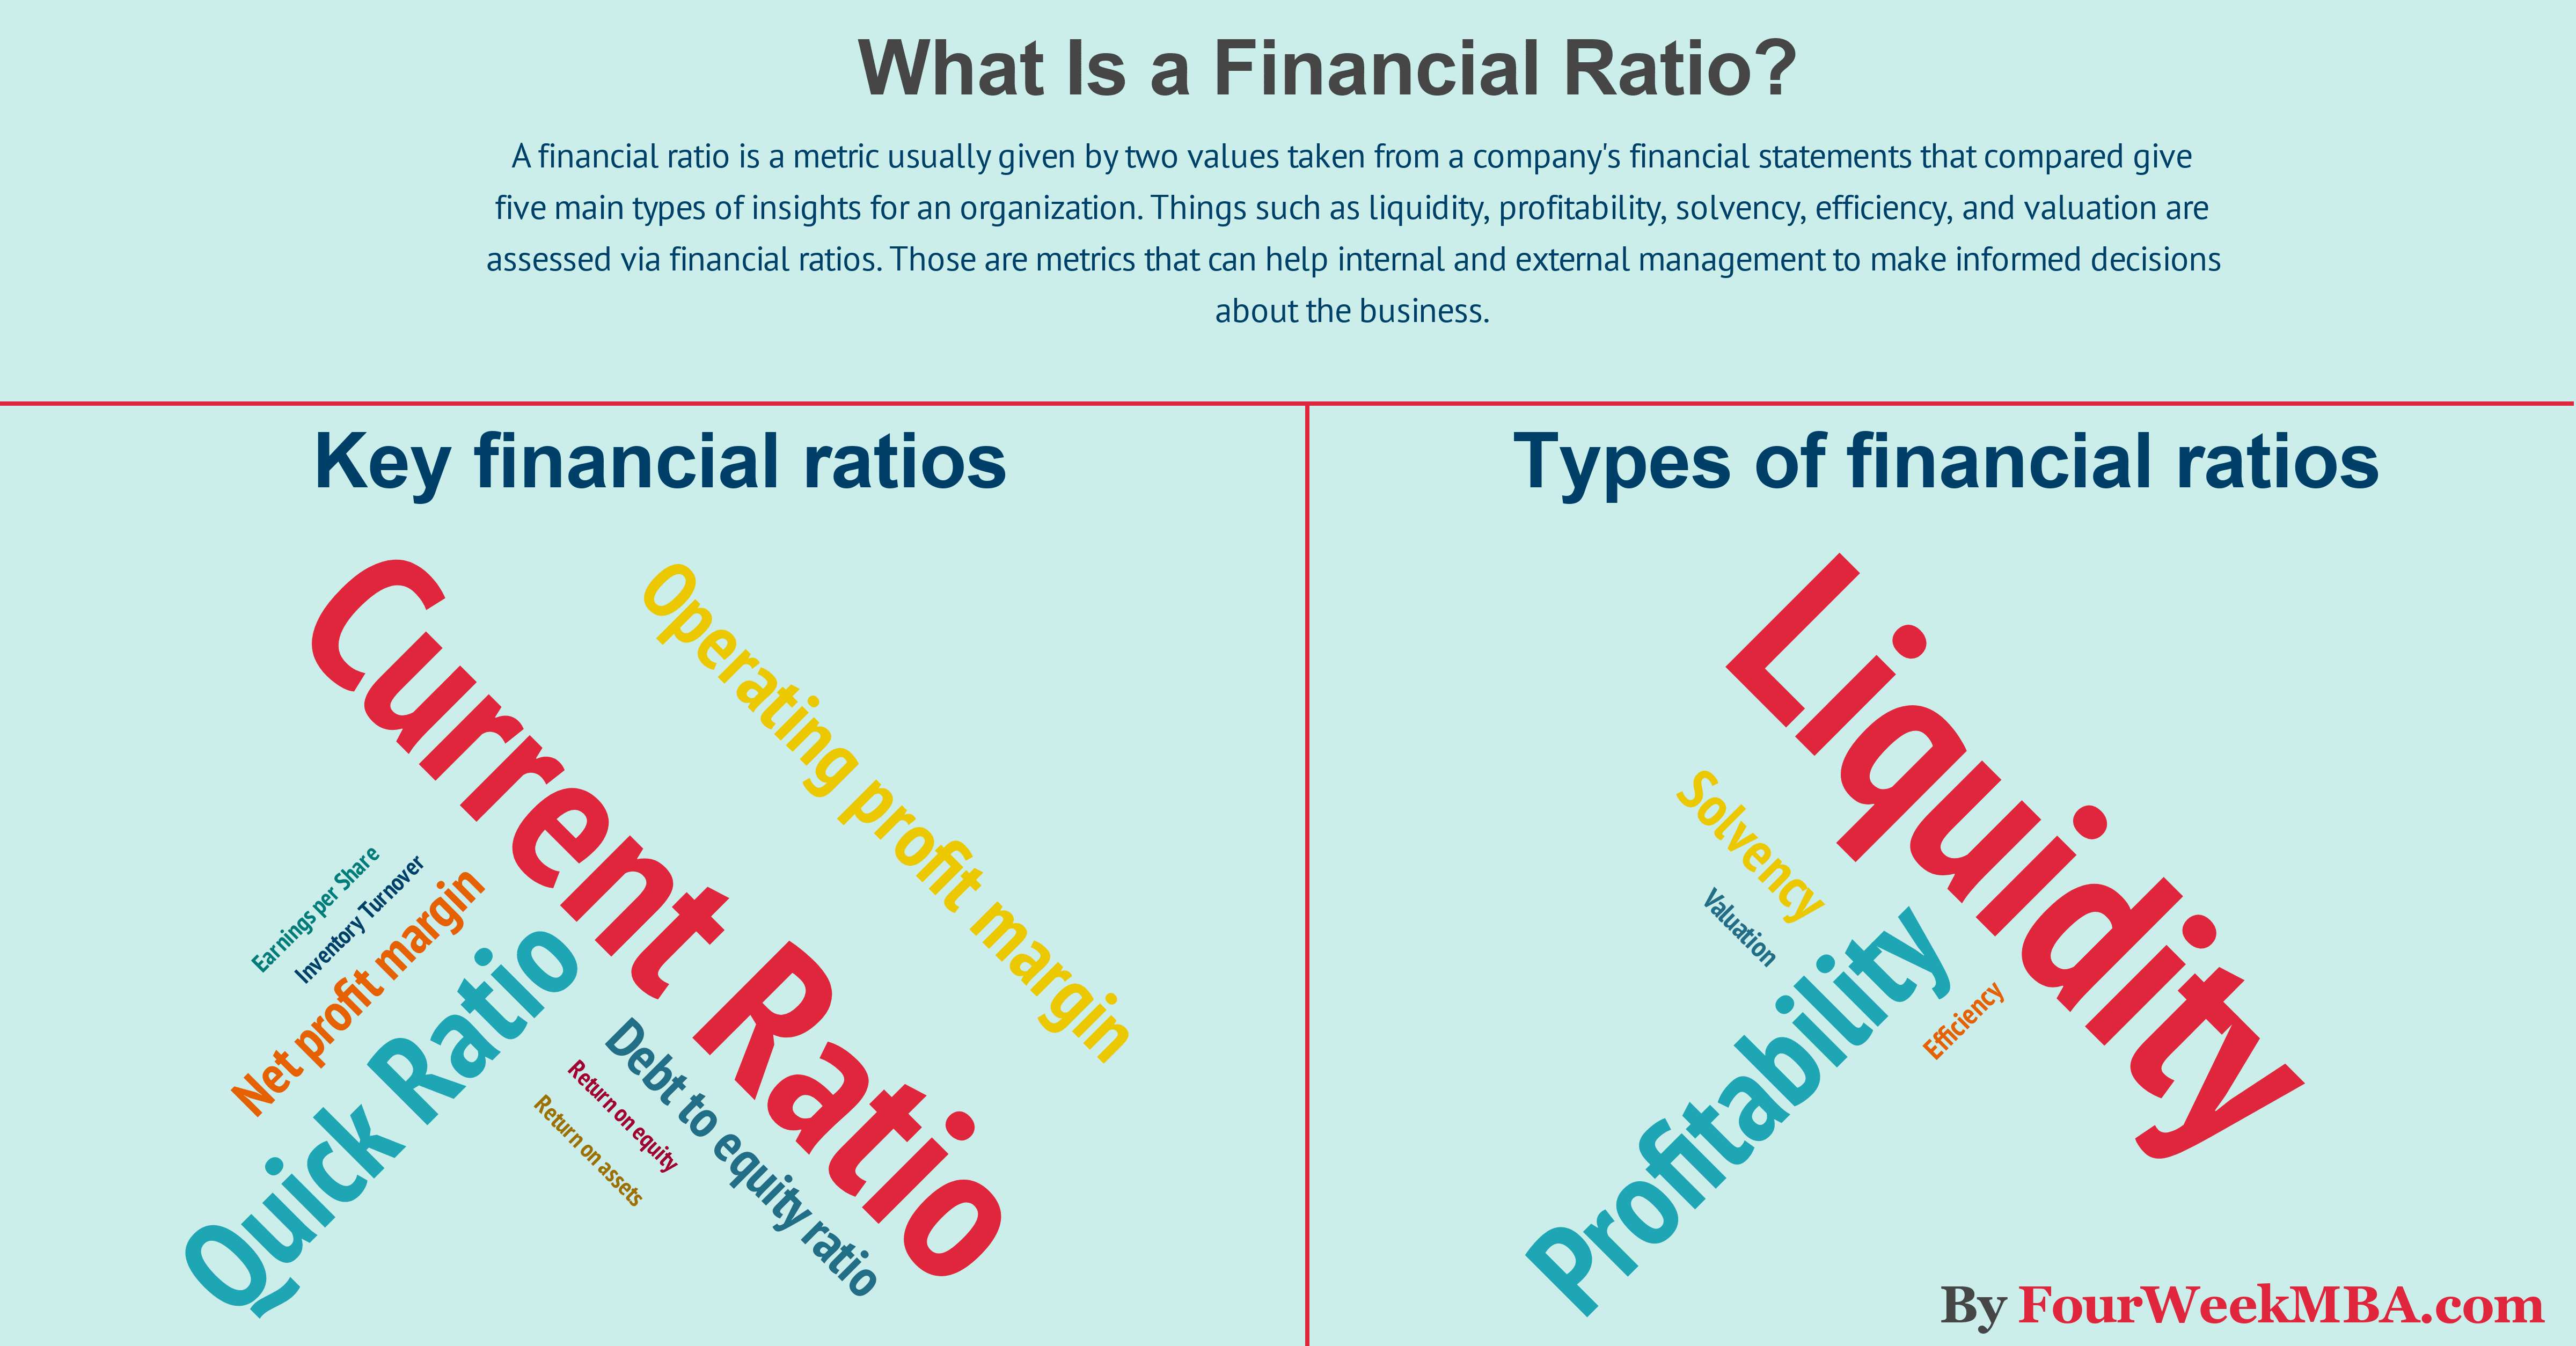
A financial ratio is a relative magnitude of two selected numerical values taken from a company’s financial statements. Essentially, ratios are mathematical expressions that help compare different pieces of financial data.
For example, the gross margin ratio takes the gross profit figure and divides it by net sales to show the percentage of revenue retained after paying cost of goods sold.
Financial ratios make it easy to compare companies of varying sizes in the same industry. Ratios also facilitate horizontal analysis of a company’s performance over time.
Overall financial ratios are useful for
- Evaluating a company’s financial health
- Detecting strengths and weaknesses
- Benchmarking against competitors
- Forecasting future performance
Common users of financial ratio analysis include:
- Company management
- Equity and credit analysts
- Individual investors
- Lenders and creditors
- Regulatory authorities
Major Categories of Financial Ratios
There are five main categories of financial ratios, each measuring a different aspect of a company’s financial performance:
1. Liquidity Ratios
Liquidity ratios measure a company’s ability to pay short-term financial obligations. Key liquidity ratios include:
- Current ratio
- Quick ratio
- Cash ratio
- Operating cash flow ratio
2. Leverage Ratios
Leverage ratios calculate the amount of debt a company uses to finance assets. Common leverage ratios are:
- Debt ratio
- Debt-to-equity ratio
- Interest coverage ratio
- Debt service coverage ratio
3. Efficiency Ratios
Efficiency ratios gauge how well a company utilizes its assets and resources. Major efficiency ratios are:
- Asset turnover ratio
- Inventory turnover ratio
- Receivables turnover ratio
- Days sales outstanding
4. Profitability Ratios
Profitability ratios quantify a company’s ability to generate profits relative to revenue, assets, equity, and other costs. Key profitability ratios include:
- Gross margin ratio
- Operating margin ratio
- Return on assets ratio
- Return on equity ratio
5. Market Value Ratios
Market value ratios relate a company’s market value and stock price to financial metrics like earnings, cash flow, and book value. Common market value ratios:
- Price-to-earnings ratio
- Price-to-book ratio
- Dividend yield
- Price-to-sales ratio
Now let’s take a closer look at some of the most widely used financial ratios within each category.
Liquidity Ratios
Liquidity ratios measure a company’s ability to pay short-term debts and financial obligations. The most common liquidity ratios used are:
Current Ratio
The current ratio measures a company’s ability to pay off short-term liabilities with current assets.
Formula:
Current Ratio = Current Assets / Current Liabilities
A current ratio between 1.2 and 2.0 is considered healthy. If the ratio is under 1.0, the company may have trouble meeting current obligations.
Quick Ratio
The quick ratio (acid test ratio) measures a company’s capacity to pay off short-term debt using only quick assets like cash, marketable securities, and accounts receivable.
Formula:
Quick Ratio = (Current Assets – Inventory) / Current Liabilities
A quick ratio of 1.0 or higher means the company can easily pay debts without selling inventory, while a ratio under 1.0 indicates potential liquidity issues.
Cash Ratio
The cash ratio calculates a company’s ability to repay liabilities with cash or cash equivalents alone.
Formula:
Cash Ratio = Cash and Cash Equivalents / Current Liabilities
A lower cash ratio isn’t necessarily bad if the company has assets that can be quickly converted to cash.
Leverage Ratios
Leverage ratios assess how much debt a company uses to finance operations and buy assets. Higher leverage typically means higher risk. Common leverage ratios are:
Debt Ratio
The debt ratio measures the portion of a company’s assets that are financed with debt rather than equity.
Formula:
Debt Ratio = Total Liabilities / Total Assets
A ratio above 0.60 means the company is heavily debt-dependent and has higher default risk.
Debt-to-Equity Ratio
The debt-to-equity ratio shows the relationship between a company’s total debt and shareholder equity.
Formula:
Debt-to-Equity Ratio = Total Liabilities / Shareholders’ Equity
A lower ratio is preferred as it indicates less financial leverage and risk for lenders and investors.
Interest Coverage Ratio
The interest coverage ratio determines how easily a company can pay interest expenses from operating income.
Formula:
Interest Coverage Ratio = EBIT / Interest Expense
A higher coverage ratio is better. Anything under 1.5 may indicate the company is overleveraged.
Efficiency Ratios
Efficiency ratios measure how well a company utilizes assets and resources to generate revenue and profits. Common efficiency metrics are:
Asset Turnover Ratio
The asset turnover ratio gauges a company’s ability to generate sales from assets.
Formula:
Asset Turnover Ratio = Net Sales / Average Total Assets
Higher asset turnover indicates the company is generating more sales per dollar of assets.
Inventory Turnover Ratio
Inventory turnover shows how many times a company sells and replaces inventory in a period.
Formula:
Inventory Turnover Ratio = Cost of Goods Sold / Average Inventory
A low turnover ratio means the company is inefficiently stocking excess inventory.
Receivables Turnover Ratio
Receivables turnover measures how many times a company can turn accounts receivable into cash during a period.
Formula:
Receivables Turnover Ratio = Net Credit Sales / Average Receivables
A higher turnover ratio indicates more efficient credit and collection policies.
Profitability Ratios
Profitability ratios demonstrate a company’s ability to generate profits relative to revenue, assets, equity, and other costs. Major profitability metrics are:
Gross Margin Ratio
The gross margin ratio shows the percentage of revenue retained as gross profit after subtracting costs of goods sold.
Formula:
Gross Margin Ratio = Gross Profit / Net Sales
A higher ratio means the company turns over a greater share of revenue into gross profit.
Operating Margin Ratio
The operating margin ratio displays the percentage of revenue remaining after operating expenses are paid.
Formula:
Operating Margin Ratio = Operating Income / Net Sales
A higher operating margin means the company is more efficient at controlling operating costs.
Return on Assets Ratio
Return on assets (ROA) measures how efficiently a company generates profits from assets.
Formula:
ROA = Net Income / Total Assets
A higher ROA indicates greater efficiency in using assets to create profits.
Return on Equity Ratio
Return on equity (ROE) gauges a company’s ability to generate net income growth using reinvested earnings.
Formula:
ROE = Net Income / Shareholders’ Equity
A higher ROE generally means the company is better at investing shareholder’s capital.
Market Value Ratios
Market value ratios relate a company’s market valuation and stock metrics to underlying financial data. Common market value ratios are:
Price-to-Earnings Ratio
The price-to-earnings (P/E) ratio compares a company’s current share price to earnings per share (EPS).
Formula:
P/E Ratio = Market Price per Share / Earnings per Share
A higher P/E may mean investors expect higher growth. Low P/E stocks can represent value opportunities.
Price-to-Book Ratio
Price-to-book ratio (P/B) evaluates a company’s market price relative to book value per share.
Formula:
P/B Ratio = Market Price per Share / Book Value per Share
Growth stocks often have higher P/B while value stocks tend to have lower P/B.
Dividend Yield
Dividend yield measures the cash dividends paid per share relative to the stock price.
Formula:
Dividend Yield = Annual Dividends per Share / Market Price per Share
A higher dividend yield may be attractive for income
What are Financial Ratios?
Financial ratios are created with the use of numerical values taken from financial statements to gain meaningful information about a company. The numbers found on a company’s financial statements – balance sheet, income statement, and cash flow statement – are used to perform quantitative analysis and assess a company’s liquidity, leverage, growth, margins, profitability, rates of return, valuation, and more.
Financial ratios are grouped into the following categories:
- Liquidity ratios
- Leverage ratios
- Efficiency ratios
- Profitability ratios
- Market value ratios
Uses and Users of Financial Ratio Analysis
Analysis of financial ratios serves two main purposes:
Determining individual financial ratios per period and tracking the change in their values over time is done to spot trends that may be developing in a company. For example, an increasing debt-to-asset ratio may indicate that a company is overburdened with debt and may eventually be facing default risk.
Comparing financial ratios with that of major competitors is done to identify whether a company is performing better or worse than the industry average. For example, comparing the return on assets between companies helps an analyst or investor to determine which company is making the most efficient use of its assets.
Users of financial ratios include parties external and internal to the company:
- External users: Financial analysts, retail investors, creditors, competitors, tax authorities, regulatory authorities, and industry observers
- Internal users: Management team, employees, and owners
Liquidity ratios are financial ratios that measure a company’s ability to repay both short- and long-term obligations. Common liquidity ratios include the following:
The current ratio measures a company’s ability to pay off short-term liabilities with current assets:
Current ratio = Current assets / Current liabilities
The acid-test ratio measures a company’s ability to pay off short-term liabilities with quick assets:
Acid-test ratio = Current assets – Inventories / Current liabilities
The cash ratio measures a company’s ability to pay off short-term liabilities with cash and cash equivalents:
Cash ratio = Cash and Cash equivalents / Current Liabilities
The operating cash flow ratio is a measure of the number of times a company can pay off current liabilities with the cash generated in a given period:
Operating cash flow ratio = Operating cash flow / Current liabilities
Leverage ratios measure the amount of capital that comes from debt. In other words, leverage financial ratios are used to evaluate a company’s debt levels. Common leverage ratios include the following:
The debt ratio measures the relative amount of a company’s assets that are provided from debt:
Debt ratio = Total liabilities / Total assets
The debt to equity ratio calculates the weight of total debt and financial liabilities against shareholders’ equity:
Debt to equity ratio = Total liabilities / Shareholder’s equity
The interest coverage ratio shows how easily a company can pay its interest expenses:
Interest coverage ratio = Operating income / Interest expenses
The debt service coverage ratio reveals how easily a company can pay its debt obligations:
Debt service coverage ratio = Operating income / Total debt service
Efficiency ratios, also known as activity financial ratios, are used to measure how well a company is utilizing its assets and resources. Common efficiency ratios include:
The asset turnover ratio measures a company’s ability to generate sales from assets:
Asset turnover ratio = Net sales / Average total assets
The inventory turnover ratio measures how many times a company’s inventory is sold and replaced over a given period:
Inventory turnover ratio = Cost of goods sold / Average inventory
The accounts receivable turnover ratio measures how many times a company can turn receivables into cash over a given period:
Receivables turnover ratio = Net credit sales / Average accounts receivable
The days sales in inventory ratio measures the average number of days that a company holds on to inventory before selling it to customers:
Days sales in inventory ratio = 365 days / Inventory turnover ratio
Profitability ratios measure a company’s ability to generate income relative to revenue, balance sheet assets, operating costs, and equity. Common profitability financial ratios include the following:
The gross margin ratio compares the gross profit of a company to its net sales to show how much profit a company makes after paying its cost of goods sold:
Gross margin ratio = Gross profit / Net sales
The operating margin ratio, sometimes known as the return on sales ratio, compares the operating income of a company to its net sales to determine operating efficiency:
Operating margin ratio = Operating income / Net sales
The return on assets ratio measures how efficiently a company is using its assets to generate profit:
Return on assets ratio = Net income / Total assets
The return on equity ratio measures how efficiently a company is using its equity to generate profit:
Return on equity ratio = Net income / Shareholder’s equity
Learn more about the different profitability ratios in the following video:
Market value ratios are used to evaluate the share price of a company’s stock. Common market value ratios include the following:
The book value per share ratio calculates the per-share value of a company based on the equity available to shareholders:
Book value per share ratio = (Shareholder’s equity – Preferred equity) / Total common shares outstanding
The dividend yield ratio measures the amount of dividends attributed to shareholders relative to the market value per share:
Dividend yield ratio = Dividend per share / Share price
The earnings per share ratio measures the amount of net income earned for each share outstanding:
Earnings per share ratio = Net earnings / Total shares outstanding
The price-earnings ratio compares a company’s share price to its earnings per share:
Price-earnings ratio = Share price / Earnings per share
Thank you for reading CFI’s guide to financial ratios. To help you advance your career in the financial services industry, check out the following additional CFI resources:
- Share this article
Create a free account to unlock this Template
Access and download collection of free Templates to help power your productivity and performance.
FINANCIAL RATIOS: How to Analyze Financial Statements
What are financial ratios?
Financial Ratios and Their Significance: Assess short-term financial health. Current Ratio: Current assets vs. current liabilities. Quick Ratio: Immediate liquidity (excludes inventory ). Absolute Ratio: Very short-term liquidity (liquid assets – accounts receivable). Measure earnings and efficiency. Gross Profit Margin: Operational efficiency.
What is a financial ratio & why is it important?
These relationships between the financial statement accounts help investors, creditors, and internal company management understand how well a business is performing and of areas needing improvement. Financial ratios are the most common and widespread tools used to analyze a business’ financial standing.
Who uses financial ratios?
Users of financial ratios include parties external and internal to the company: Liquidity ratios are financial ratios that measure a company’s ability to repay both short- and long-term obligations. Common liquidity ratios include the following: The current ratio measures a company’s ability to pay off short-term liabilities with current assets:
What are the 5 types of financial ratios?
There are five main types of financial ratios: liquidity, profitability, solvency, efficiency, and valuation. Liquidity helps in assessing the short-term availability of cash or cash equivalents of an organization. While profitability helps understand how profitable a company is.
