As data scientists and statisticians, evaluating the quality of our models is a crucial part of the model building process. Two of the most commonly used metrics for regression model evaluation are the standard error of regression (S) and the R-squared value (R2). While both provide important information about model fit, they measure slightly different things. In this article, we’ll look at the key differences between S and R2 and when you may want to favor one over the other.
What is the Standard Error of Regression?
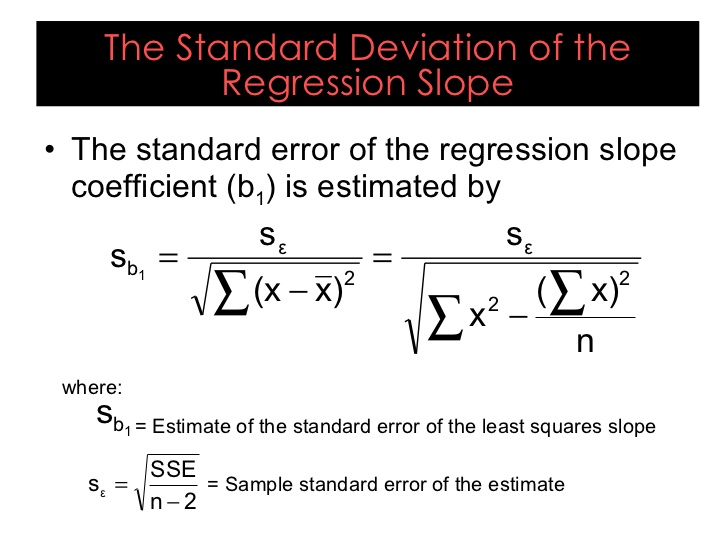
The standard error of regression, also called the standard error of the estimate, tells us how tightly the data points cluster around the regression line. It measures the amount of variability in the dependent variable that is left unexplained after fitting the regression model.
S is calculated as the square root of the mean squared error (MSE) of the residuals, The residuals are the vertical distances between the observed data points and the values predicted by the regression line S is expressed in the same units as the response variable and can be interpreted as the typical error between the actual y values and the y values predicted by the model,
Lower values of S indicate less variability around the regression line and thus a tighter fit of the model to the data. An S value of 0 would indicate a perfect fit.
What is R-squared?
R-squared, also known as the coefficient of determination, measures how successful the regression model is in explaining the variation in the response variable. It represents the proportion of variance in y that can be attributed to the explanatory variables in the model.
R2 is calculated as 1 – (SSE/SST), where:
- SSE is the residual or error sum of squares
- SST is the total sum of squares
R2 values range from 0 to 1, with values closer to 1 indicating more of the variance is accounted for by the model. An R2 of 0 means the model does not explain any of the variability, while an R2 of 1 indicates the model perfectly fits the data.
Key Differences Between S and R2
While S and R2 both indicate model fit, there are some notable differences:
-
Scale: S is measured in the units of the response variable, while R2 is a unit-less proportion between 0 and 1.
-
Context: S provides an absolute measure of precision, while R2 provides a relative measure. S tells you how wrong the predictions are on average, while R2 tells you the proportion of variance explained.
-
Nonlinear models: S can be used for nonlinear models, but R2 has limited interpretability for nonlinear regression.
-
Model complexity: As more variables are added, R2 will always increase, even if the new variables have no real relationship with y. But S will decrease only if the new variables improve the model.
-
Range of values: There are no limits on how small S can be. However R2 values are constrained between 0 and 1.
When to Report Each Metric
In practice, I recommend reporting both S and R2 when evaluating regression models, as they provide complementary information about model fit.
R2 is useful for providing a quick, high-level view of how much variation is explained by the model. It is most valuable when comparing competing models – typically you want the model with the highest R2.
However, if your goal is predicting new observations and you need to understand the expected error, S becomes more important. Checking if S meets your required level of precision is crucial. S is also preferable for nonlinear regression.
In short:
-
Use R2 to compare models and select the best model explaining the most variance.
-
Use S to evaluate precision of predictions and whether your model meets the required accuracy.
-
For nonlinear models, rely on S rather than R2.
Example Comparing S and R2
Let’s look at an example regression model predicting life expectancy from per capita GDP. Here is the output from the regression:
Regression Statistics R-squared: 0.807Standard Error: 4.23 yearsModel Coefficients:Intercept: -39.6 GDP Per Capita: 0.004The R2 value of 0.807 tells us that 80.7% of the variance in life expectancy is explained by per capita GDP. This is a relatively good R2, indicating GDP is a useful predictor.
However, if we want to predict life expectancy for a new country, the standard error of 4.23 years is more informative. It suggests our predictions will be off by around 4 years on average. Whether this is acceptable depends on our specific requirements.
For making predictions, S gives a more practical sense of the expected accuracy than the abstract R2 value. Reporting both statistics provides a comprehensive view of model quality.
Tips for Using S and R2
Here are some tips when using these metrics:
-
Don’t rely solely on R2 for nonlinear models. Ensure your nonlinear models have a sufficiently low S.
-
Don’t panic if your R2 is low. The model can still be useful if S meets your precision needs.
-
Check that S is stable by running cross-validation. High variance in S indicates overfitting.
-
Make sure variables are on a similar scale before comparing models based on R2. Standardizing data can help.
-
Report S in your model summary alongside R2 to show expected accuracy.
-
Set a minimum required S based on your precision needs before accepting a model.
By understanding the nuanced differences between the standard error of regression and R-squared, we can effectively evaluate the quality of our regression models and select the right metrics for the job. Tracking both statistics provides a comprehensive view of model performance.
Frequency of Entities:
standard error of regression: 16
R-squared: 16
R2: 7
S: 14
2 Answers 2 Sorted by:
In regression anaylsis, both R-squared and standard error are measures of the goodness-of-fit.
As you correctly noted, a R-squared of 60% can be interpreted as house size explaining 60% of the variation in house prices.
Whilst a standard error of 5.9 (assuming you work in units of millions) can be interpreted as meaning that the model you have fitted will, based on a certain house size, output house prices that on average deviate from your data by 5.9 millions.
The expression standard error is frequently used to describe the standard deviation of a quantity under consideration.
If in your case the standard error refers to the house price, then the empirical standard deviation of your house prices will be 5.9.
The r-squared is computed as 1 minus the quotient of the mean-squared error and the variance of your dependent variable.
In particular, for the house-price example, you can conclude that the mean-squared error equals (1-0.6)*5.9*5.9=13.92
Reminder: Answers generated by artificial intelligence tools are not allowed on Stack Overflow. Learn more
Thanks for contributing an answer to Stack Overflow!
- Please be sure to answer the question. Provide details and share your research!
- Asking for help, clarification, or responding to other answers.
- Making statements based on opinion; back them up with references or personal experience.
To learn more, see our tips on writing great answers. Draft saved Draft discarded
Sign up or log in Sign up using Google Sign up using Email and Password
Required, but never shown
Regression and R-Squared (2.2)
What is the difference between standard error and R squared?
Standard error is used when we want to measure the spread of datapoints around the regression line. R squared is used when we want the goodness of fit. However if both are combined then they can be used to check whether the model is overfitting or not. All the metrics play an important role in evaluation of regression model.
What is the difference between R-Squared and standard error?
The standard error of the regression (S) and R-squared are two key goodness-of-fit measures for regression analysis. While R-squared is the most well-known amongst the goodness-of-fit statistics, I think it is a bit over-hyped. The standard error of the regression is also known as residual standard error.
What does R-squared mean in a regression model?
For R-squared, you want the regression model to explain higher percentages of the variance. Higher R-squared values indicate that the data points are closer to the fitted values. While higher R-squared values are good, they don’t tell you how far the data points are from the regression line. Additionally, R-squared is valid for only linear models.
How do you find the standard error of a regression?
As R-squared increases and S decreases, the data points move closer to the line You can find the standard error of the regression, also known as the standard error of the estimate, near R-squared in the goodness-of-fit section of most statistical output. Both of these measures give you a numeric assessment of how well a model fits the sample data.
