As a data analyst being able to accurately quantify the uncertainty in your estimates and predictions is a crucial skill. Two of the main methods for doing this are confidence intervals and prediction intervals. While these two types of statistical intervals may seem similar at first glance there are some important distinctions between them that you need to understand. In this article, I’ll explain in simple terms the key differences between prediction intervals and confidence intervals, so you can choose the right method for your specific analysis needs.
What is a Confidence Interval?
A confidence interval gives you a range of values that is likely to contain the true value of a population parameter based on sample data. The most common example is constructing a confidence interval to estimate the true population mean.
Here’s a simple example to understand confidence intervals:
Let’s say we collect a random sample of 50 heights from adult men in the US and calculate the sample mean (average) height to be 70 inches. We can then use this sample data to calculate a 95% confidence interval of 68 to 72 inches.
What does this 95% confidence interval tell us? It tells us that if we collected 100 random samples of 50 men and constructed 100 confidence intervals using this procedure, about 95 of those intervals would contain the true average height for the population of adult men.
However, we don’t actually know if our specific interval of 68 to 72 inches covers the true mean height or not. The confidence level applies to the procedure, not an individual interval.
The key things to note about confidence intervals are:
-
They estimate population parameters like the mean, standard deviation, proportion, etc.
-
Wider intervals indicate less precision, narrower intervals indicate more precision.
-
The confidence level applies to the process, not an individual interval.
What is a Prediction Interval?
A prediction interval is used to estimate the range of values that are likely to contain a single new observation from the same population. Prediction intervals are always wider than confidence intervals due to greater uncertainty when predicting an individual value compared to the population mean.
Let’s look at an example of a prediction interval:
We collect a random sample of heights and build a regression model that uses weight to predict height. For a man that weighs 180 lbs, our regression model predicts a height of 70 inches.
We can construct a 95% prediction interval of 66 to 74 inches around this height prediction. This means that if we collect 100 random samples, build 100 regression models, and get 100 prediction intervals for a man weighing 180 lbs, approximately 95 of those intervals will contain his true height.
The key things to understand about prediction intervals are:
-
They estimate an individual value, not a population parameter.
-
They account for uncertainty in the model’s predictions.
-
The confidence level applies to the prediction interval process.
Confidence Intervals for Regression Predictions
There is one scenario where confidence intervals can relate to predictions – constructing a confidence interval around a prediction from a regression model.
This is different than a regular prediction interval. The confidence interval around a regression prediction gives a range for the average value, not an individual value.
For example, our regression model predicts that on average, men weighing 180 lbs have a height of 70 inches. We construct a 95% confidence interval around this predicted value of 69 to 71 inches. This means we are 95% confident that the true average height for men weighing 180 lbs falls within this interval.
But this doesn’t tell us anything about the distribution of heights for individual men at 180 lbs. For that, we need to use a prediction interval instead of a confidence interval.
Choosing Between Confidence and Prediction Intervals
Now that you understand the core differences, how do you know when to use confidence intervals versus prediction intervals in your own analyses?
Here are some general guidelines:
-
If you want to estimate a population parameter like the mean, use a confidence interval.
-
If you want to estimate an individual value or future observation, use a prediction interval.
-
If you want to estimate how precisely your model can make predictions, use a prediction interval around regression predictions.
-
If you want to describe the spread of individual data points, use a tolerance interval.
-
For time series forecasting, use prediction intervals around your forecasts.
Let’s look at some examples to solidify when each type of interval is appropriate:
Example 1
You conduct a survey of 100 people about their salary. To estimate the true average salary in the population, use a confidence interval around the sample mean salary.
Example 2
You build a regression model for housing prices based on house size, location, etc. For a 1300 sqft house in the suburbs, you want to estimate the sale price range. Use a prediction interval around the model’s price prediction.
Example 3
Your sales forecasting model predicts monthly product sales. To estimate the uncertainty in the predictions, use prediction intervals around each forecast.
Example 4
You take a sample of products to test their durability. To estimate the range that covers 99% of the products, use a tolerance interval.
As you can see, being clear about your goal – whether it’s to estimate a population parameter, a future observation, or model prediction accuracy – will tell you whether a confidence interval or prediction interval is appropriate.
How to Calculate Prediction Intervals and Confidence Intervals
Many statistical software packages like R, Python, SAS, etc. have built-in functions to calculate prediction intervals and confidence intervals for you once you input your sample data or model. So you often don’t need to do these calculations manually.
However, it’s still useful to understand the basic formulas behind confidence and prediction interval calculations.
Here are some key points:
-
Both intervals center around a point estimate – the sample mean for confidence intervals or the model predicted value for prediction intervals.
-
The width of the intervals depends on the standard error of the point estimate.
-
A multiplier value (based on a t-distribution) determines the final width for a certain confidence level. Wider intervals require a larger t-value.
-
Prediction intervals are wider than confidence intervals because the standard error for an individual prediction is larger than the standard error of the sample mean that confidence intervals use.
If you’re interested in the mathematical details, you can research the specific formulas online. But for applied purposes, just remember that statistical software can handle the calculations automatically once you feed it the necessary data.
Examples of Confidence Intervals vs Prediction Intervals
Let’s walk through some numerical examples to really solidify when to use confidence intervals versus prediction intervals.
Example 1 – Estimating average life expectancy
You collect a random sample of 200 people and calculate a mean life expectancy of 75 years. Using sample data, you construct a 95% confidence interval of 74 to 76 years for the true mean life expectancy of the population.
Example 2 – Predicting life expectancy for an individual
Using health and demographic data, you build a regression model for predicting an individual’s life expectancy. For a 45 year old woman with a healthy BMI, your model predicts a life expectancy of 80 years. Using this point prediction, you construct a 95% prediction interval of 77 to 83 years for the next individual matching these characteristics.
Example 3 – Forecasting product demand
Your time series model forecasts that average monthly demand for your product will be 1500 units over the next year. To estimate the accuracy of the forecasts, you construct 95% prediction intervals around each forecast. For example, the demand forecast for January is 1500 units, with a 95% prediction interval of 1400 to 1600 units.
Example 4 – Estimating average household income
You survey a random sample of 500 households about their income. The sample mean income is $63,000. To estimate the population mean income, you construct a 95% confidence interval of $61,000 to $65,000 around the sample mean.
In each example, think about whether we are trying to estimate a population parameter or an individual value. This tells you whether a confidence interval or prediction interval is appropriate.
Summary of Main Differences
To recap, here are the key differences between prediction intervals and confidence intervals:
-
Confidence intervals estimate population parameters like the mean. Prediction intervals estimate individual values.
-
Confidence intervals have a narrower range compared to prediction intervals due to lower uncertainty.
-
The confidence level applies to the process used to generate the intervals, not to individual intervals themselves.
-
Use confidence intervals when your goal is to describe characteristics of a population. Use prediction intervals when your goal is to predict individual future observations.
Being able to clearly explain how prediction and confidence intervals differ shows that you have an in-depth understanding of statistical estimation and uncertainty. So take the time to cement your knowledge of which type of interval to use for a given analytical goal. Understanding prediction vs confidence intervals will serve you well as you continue your journey to become an expert data analyst.
Frequency of Entities:
confidence interval: 22
prediction interval: 21
interval: 16
population: 10
sample: 8
individual: 7
mean: 6
standard error: 3
regression: 3
observation: 3
estimate: 3
parameter: 2
uncertainty
Predicted Interval for correlated y vs x Created: | Last Modified:
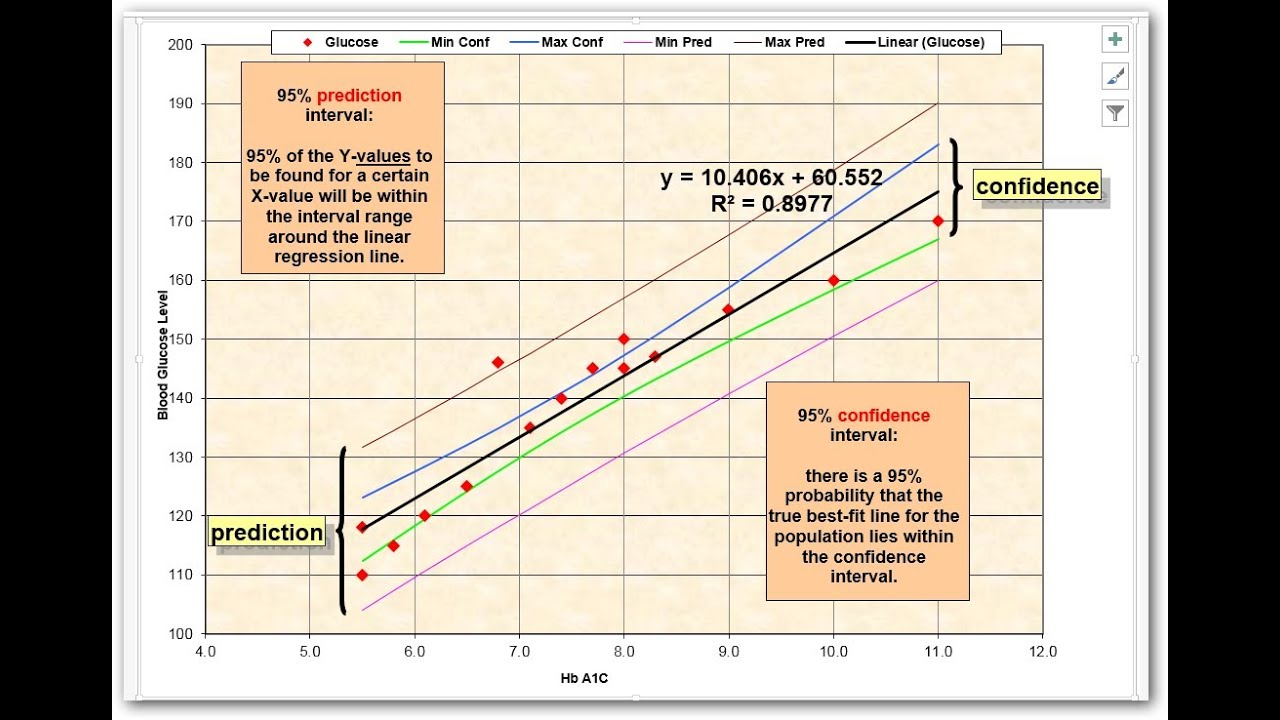
I have two variables that are correlated and like to get prediction interval for y vs x at 9.9%. I can do this for linear regression fit. My questions is whether there are other techniques than can accomplish this. I have attached y vs.x with regression line. In particular I like to know what range of x variable gives all the y variable between (a,b) at 99.9% confidence.
Re: Predicted Interval for correlated y vs x
With this much data you should expect some points to lie outside the confidence interval (regardless of the %). If it is a mean confidence interval, indeed most points would like outside the interval. If they are individual predictions, then fewer should be outside the interval. Since the model is not perfect (it is only a model), of course some points will randomly vary outside the interval.
However, the graph you provide suggests something else is going on. There is an entire section of points outside the interval – this strongly suggests a lurking variable (likely a nominal variable) that is giving two groups of responses. So, conditional on x, y appears to fall into two distinct ranges. Failure to identify this lurking grouping variable means that the resulting confidence interval is too wide – and also, that at least one group will systematically (not randomly) lie outside the interval.
Prediction versus Confidence Intervals
What is the difference between a confidence interval and a prediction interval?
Prediction intervals can arise in both Bayesian or frequentist statistics. Since the confidence interval only accounts for error from source #2 and the prediction interval accounts for all five sources of errors, the confidence intervals for the mean will always be narrower than prediction intervals.
What is a confidence interval?
A confidence interval of the prediction is a range that likely contains the mean value of the dependent variable given specific values of the independent variables. Like regular confidence intervals, these intervals provide a range for the population average.
How do you know if a prediction interval contains the true parameter?
It may sound counter-intuitive but think about it. To have more confidence that an interval contains the true parameter, the range should be wider. e.g I can be 100% confident that the bouncing height of the ball is 0 to infinity. I hope you got an idea of confidence intervals, now let’s see what prediction intervals are.
What is a prediction interval?
Prediction intervals represent a range of values that are likely to contain the true value of some response variable for a single new observation based on specific values of one or more predictor variables. For example, suppose we fit a simple linear regression model that uses the number of bedrooms to predict the selling price of a house:
