Net operating profit after tax (NOPAT) is a crucial yet often misunderstood financial metric. As bloggers, it’s our job to demystify complex financial concepts like NOPAT so everyday investors can utilize them effectively. In this comprehensive guide, we’ll cover everything you need to know about NOPAT and how to use it to evaluate company performance.
What is NOPAT?
NOPAT stands for net operating profit after tax. It measures a company’s after-tax operating profit excluding any financing costs like interest expenses.
In simple terms, NOPAT shows how much cash a business generates solely from its core operations. This gives investors a clear picture of the underlying profitability of the business independent of how it is financed.
Here is the formula to calculate NOPAT
NOPAT = Operating Profit x (1 - Tax Rate) Or alternatively
NOPAT = Net Income + After-Tax Interest ExpensesLet’s break this down quickly:
-
Operating Profit: A company’s revenue minus operating expenses like the cost of goods sold and overhead. This represents earnings before interest and taxes (EBIT).
-
Tax Rate: The average tax rate paid by the company. Usually between 20-30% for US companies.
-
Net Income: Bottom line profit on the income statement after all expenses.
-
After-Tax Interest Expenses: The company’s interest expense multiplied by (1 – Tax Rate). This removes the tax benefit of debt financing.
That’s the basics of how to calculate NOPAT! Next let’s look at why it matters.
Why NOPAT Is Useful for Analysis
NOPAT is useful for a few key reasons:
-
Excludes distortion from financing – By removing interest expenses, NOPAT provides a clear view of the profitability of a company’s operations without the effects of capital structure and debt financing. This allows for an apples-to-apples comparison between companies with different levels of debt.
-
Cash generation measure – Since interest and taxes are excluded, NOPAT approximates the cash generating ability of the company’s core business activities. This is helpful for valuation purposes.
-
Efficiency benchmark – NOPAT margins can be compared over time to evaluate the operating efficiency of a business. Improving NOPAT margins indicate the company is generating more cash from its existing asset base.
-
Value creation analysis – NOPAT is a key input for value creation metrics like economic value added (EVA). It helps quantify true economic profit after the cost of capital is considered.
Now let’s look at a quick example to see NOPAT in action.
NOPAT Example
Let’s say Hypothetical Company has the following metrics:
- Revenue: $1 billion
- Operating Expenses: $700 million
- Operating Profit: $300 million
- Interest Expense: $100 million
- Tax Rate: 25%
Operating Profit = Revenue – Operating Expenses = $1,000 million – $700 million = $300 million
Here are the NOPAT calculations:
NOPAT = Operating Profit x (1 - Tax Rate) = $300 million x (1 - 25%) = $300 million x 75% = $225 millionNOPAT = Net Income + After Tax Interest Expenses = $200 million + ($100 million x 75%) = $200 million + $75 million = $225 million So Hypothetical Company has a NOPAT of $225 million. This represents the after-tax cash flows generated by its operating activities, unburdened by interest expenses.
NOPAT margins can also be calculated by dividing NOPAT by revenue. Here the NOPAT margin is 22.5% ($225 million / $1 billion). This shows the company generates 22.5 cents of cash operating profit from each dollar of revenue.
The NOPAT margin can be tracked over time to gauge operational efficiency improvements or declines. It provides an insightful cash flow view of the business.
Key Things to Remember About NOPAT
Here are some key pointers to remember about NOPAT:
- Use it for comparability between companies with different capital structures. NOPAT provides an “apples-to-apples” view.
- Focus on operational efficiency by comparing NOPAT margins over time or against competitors.
- Use it to evaluate true cash generation ability from operations.
- Utilize NOPAT to calculate value creation metrics like EVA.
- Ignore one-time or non-recurring expenses to get a view of normalized profitability.
Limitations of NOPAT
While very useful, NOPAT also has some limitations to keep in mind:
- Difficult to calculate accurately due to tax complexity – Must make adjustments for deferred taxes, loss carryforwards etc.
- Does not reflect balance sheet health or liquidity – NOPAT focuses just on income statement.
- Susceptible to manipulation via operating expenses. Need to assess quality of earnings.
- Historical focus – Does not consider future growth prospects or capital expenditures needed to maintain business.
For these reasons, NOPAT should always be assessed in conjunction with other metrics as part of a holistic analysis. It reveals a lot about a company’s profit engine but does not tell the whole story on its own.
NOPAT is a powerful, yet often overlooked metric that offers deep insights into a company’s core earnings power. By stripping away the impact of financing costs and taxes, it homes in on true operating cash generation.
The comparability, efficiency benchmarking, and cash flow focus provided by NOPAT can greatly inform investment analysis and business valuation. But it should be complemented by other key financial metrics and qualitative assessments.
Frequency of Entities:
NOPAT: 25
operating profit/income: 7
tax rate: 7
net income: 4
interest expense: 5
revenue: 3
operating expenses: 3
EBIT: 1
capital structure: 2
debt financing: 1
valuation: 2
cash flow: 4
efficiency: 4
margins: 3
value creation: 2
EVA: 2
liquidity: 1
growth prospects: 1
capital expenditures: 1
NOPAT Calculation Analysis
Conceptually, we know our end goal is to net out the impact of estimated taxes from operating income (EBIT).
In the first approach, the calculation is straightforward, as we just multiply EBIT by (1 – Tax Rate).
If we input the relevant data points into our NOPAT formula, we get the following equation:
- NOPAT = $210m × (1 – 35%) = $137m
Note that despite the fact that Company B benefited from the interest tax shield, the value for both companies is equivalent.
Capital Structure Analysis
The financials of our hypothetical companies begin to diverge because of a non-operating expense, interest expense.
Further, the interest expense incurred is a function of each company’s capital structure (i.e. the debt-to-equity mix).
While Company A is an all-equity financed company with zero interest expense, Company B has incurred $100m of interest expense, which reduces its taxable income since interest is tax-deductible.
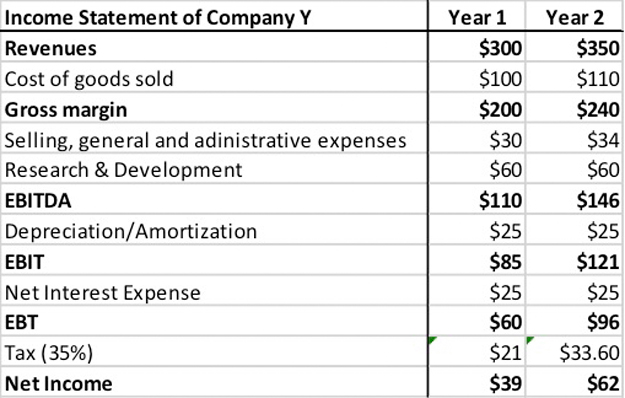
At the pre-tax income line (EBT), we see the following divergence:
- EBT, Company A = $210m
- EBT, Company B = $110m
The source of the $100m difference is the interest expense mentioned earlier – furthermore, the taxes of the two companies vary significantly because of the tax savings associated with interest (i.e. the “interest tax shield”).
At a 35% tax rate, the companies pay the following taxes:
- Taxes Paid, Company A = $74m
- Taxes Paid, Company B = $39m
Here, Company B has benefited from $35m in tax savings ($74m – $39m).
Net Operating Profit After Taxes
How to calculate net operating profit after tax?
NOPAT = Operating profit X (1 – Tax rate) If a detailed income statement isn’t available and you can’t figure out the operating in come of the company, you can always calculate the net operating profit after tax equation using net income by backing out the interest payments like this. NOPAT = Net Profit + Net Interest X (1 – Tax rate)
What is net operating profit after tax (NOPAT)?
Net operating profit after tax (NOPAT) measures the efficiency of a leveraged company’s operations. NOPAT excludes tax savings from existing debt and one-time losses or charges. Mergers and acquisitions analysts use NOPAT to calculate the free cash flow to firm (FCFF) and economic free cash flow to firm.
What is the difference between operating profit and net profit?
Operating profit doesn’t take into account the tax implication on the profitability, while net profit includes the impact of interest payment (and the corresponding tax benefit – remember tax is calculated after reducing interest payment). This is where the concept of NOPAT comes in. It is the operating profit of a company after reducing the tax.
Why is net operating profit after tax different than free cash flow?
Additionally, it includes depreciation and amortization (a non-cash expense) and doesn’t include capital expenditures (an actual cash expense). For these reasons, Net Operating Profit After Tax can be materially different than Free Cash Flow.
