For many students in Grades 8 and up, the numbers and shapes theyve learned about really start to come together when they are making and solving linear equations. This topic integrates ideas about algebra, geometry, and functions and can be difficult for many children—and adults!—to wrap their heads around. This article explains what a linear equation is and walks through different examples. Then it offers lesson ideas for introducing and developing the concept of linear equations in one variable to your students.
Linear equations are a fundamental concept in algebra that describe straight lines. Mastering how to write linear equations in various forms unlocks your ability to analyze graphs, solve complex problems, and visualize relationships between variables.
Follow this comprehensive guide to learn the key forms of linear equations and how to write them correctly every time.
What is a Linear Equation?
A linear equation contains one or more variables and features an exponent of 1 for all variable terms The graph forms a straight line For example
- y = 2x + 1
- 5x + 3y = 12
- z/2 = 4 – x
The variables are not squared, cubed, or raised to any other power besides 1.
Key features of linear equations:
- Graph is a straight line
- At most, the degree of variables is 1
- No variable terms with exponents besides 1
- Usually contains constants like numbers or coefficients
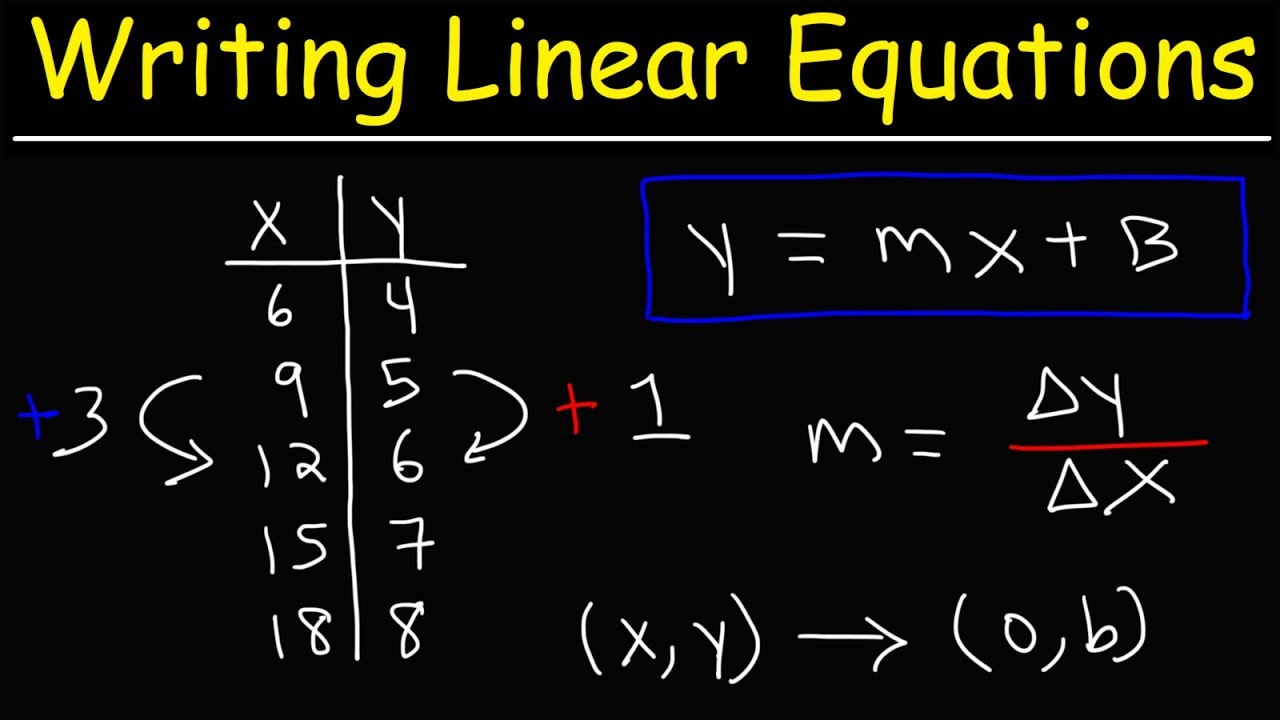
Slope-Intercept Form
The most common form of writing a linear equation is slope-intercept form
y = mx + b
- m is the slope – determines steepness and if the line rises or falls from left to right.
- b is the y-intercept – the point where the line crosses the y-axis.
- x and y are variable placeholders
To write in slope-intercept form:
- Identify the slope (m)
- Identify the y-intercept (b)
- Write the equation in the format y = mx + b
For example, for a line with slope 3 that crosses the y-axis at point (0, -2), the equation would be:
y = 3x – 2
The x coefficient is the slope and the constant is the y-intercept.
Point Slope Form
You can also write a linear equation from a point on the line and its slope. The point slope form is:
y – y1 = m(x – x1)
- m is the slope
- (x1, y1) is a point on the line
- x and y are variables
To write in point slope form:
- Identify the slope (m)
- Identify a point on the line (x1, y1)
- Plug m, x1, and y1 into the equation
For a line with slope -2 containing point (4, 3), the equation would be:
y – 3 = -2(x – 4)
The slope is -2 and (4, 3) is the point.
General Form
The general form of a linear equation is:
Ax + By = C
- A and B are coefficients of the variable terms x and y
- C is a constant
To write in general form:
- Identify the x coefficient (A)
- Identify the y coefficient (B)
- Identify the right side constant (C)
- Construct the equation as Ax + By = C
If the x term coefficient is 5, the y term coefficient is -3, and the right side constant is 2, the general form equation would be:
5x – 3y = 2
Writing Horizontal and Vertical Lines
Horizontal and vertical lines are special linear equations:
Vertical: x = b
The x coordinate stays fixed while y varies.
Horizontal: y = k
The y coordinate stays fixed while x varies.
To write vertical or horizontal equations, simply set x or y equal to the fixed constant.
Converting Between Forms
You may need to take a linear equation and rewrite it in a different form for certain problems. Here are some examples:
Slope-intercept → Point slope
y = 3x + 2
- Identify slope: m = 3
- Identify point: (0, 2)
- Plug into point slope form:
y – 2 = 3(x – 0)
Point slope → General
y – 5 = 2(x + 1)
- Isolate y term:
y = 2x + 7 - Identify coefficients:
A = 2, B = 1, C = 7 - Write in general form:
2x + y = 7
Practice moving between forms to get comfortable converting linear equations as needed.
Graphing Linear Equations
An easy way to check your work when writing linear equations is to graph the line and inspect it. Does the graph accurately represent your equation? If not, rewrite the equation fixing any mistakes.
You can quickly graph lines in slope-intercept or general form using:
- Slope and y-intercept
- X and y coefficients
Examine the visual graph to confirm the equation models the intended line.
Key Takeaways
- Know the characteristics that make equations linear, especially exponents of 1 for variables.
- Memorize the three main forms: slope-intercept, point slope, and general.
- Use the step-by-step process to correctly construct linear equations in any form.
- Practice inter-converting between different forms like slope-intercept to general.
- Graph lines to visually confirm your equations are accurate.
With these tips, techniques, and examples to guide you, writing linear equations in the appropriate form for any situation will become second nature. Mastering this foundational algebraic skill unlocks your ability to solve complex problems, reason abstractly, and comprehend advanced mathematical concepts down the road.
Example 3: number of angles of a polygon = number of sides of that polygon
Again in this graph, we are relating values that only make sense if they are positive, so we show points only in the first quadrant. Moreover, in this case, since no polygon has fewer than 3 sides or angles and the number of sides or angles of a polygon must be a whole number, we show the graph starting at (3,3) and indicate with a dashed line that points between those plotted are not relevant to the problem.

What Is a Linear Equation?
Just like any other equation, a linear equation is made up of two expressions set equal to each other. There are some key features common to all linear equations:
- A linear equation only has one or two variables.
- No variable in a linear equation is raised to a power greater than 1 or used as the denominator of a fraction.
- When you find pairs of values that make a linear equation true and plot those pairs on a coordinate grid, all of the points lie on the same line. The graph of a linear equation is a straight line.
A linear equation in two variables can be described as a linear relationship between x and y, that is, two variables in which the value of one of them (usually y) depends on the value of the other one (usually x). In this case, x is the independent variable, and y depends on it, so y is called the dependent variable.
Whether or not its labeled x, the independent variable is usually plotted along the horizontal axis. Most linear equations are functions. In other words, for every value of x, there is only one corresponding value of y. When you assign a value to the independent variable, x, you can compute the value of the dependent variable, y. You can then plot the points named by each (x,y) pair on a coordinate grid.
Students should already know that any two points determine a line. So graphing a linear equation in fact only requires finding two pairs of values and drawing a line through the points they describe. All other points on the line will provide values for x and y that satisfy the equation.
The graphs of linear equations are always lines. However, it is important to remember that not every point on the line that the equation describes will necessarily be a solution to the problem that the equation describes. For example, the problem may not make sense for negative numbers (say, if the independent variable is time) or very large numbers (say, numbers over 100 if the dependent variable is grade in class).
