A master budget is an important planning tool for businesses of all sizes. It integrates all of a company’s budgets into one comprehensive document that projects expected revenues, expenses, and profits over a specific time period
Developing a master budget provides businesses with a roadmap for their financial goals. It allows companies to thoughtfully plan their operations, cash management, and strategy based on forecasted figures.
In this step-by-step guide, I’ll walk through the entire process of how to prepare a master budget from start to finish. Whether you’re an entrepreneur, accountant, financial analyst, or manager, follow these tips to create a useful, accurate master budget for your organization.
What is a Master Budget?
A master budget is a long-term budget that outlines an organization’s financial plans for the coming year. It brings together different component budgets into one combined budget document.
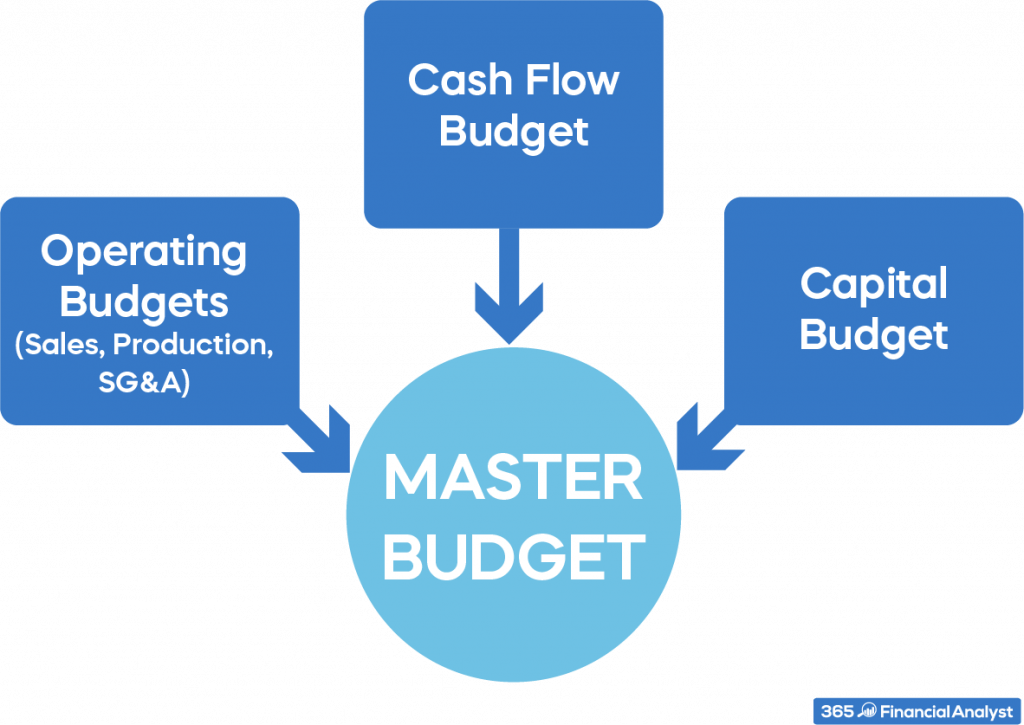
The master budget typically includes
- Sales budget – Expected revenues from sales of products and services
- Production budget – Plan for producing or manufacturing goods to meet sales goals
- Materials budget – Costs of raw materials and component parts needed for production
- Direct labor budget – Labor costs involved directly in making products
- Manufacturing overhead budget – Indirect production costs like utilities and equipment maintenance
- Selling and administrative budget – Non-production operating expenses like marketing, R&D, payroll
- Capital expenditures budget – Planned investments in assets like property, equipment, vehicles
- Cash budget – Projected cash inflows and outflows from all business activities
Bringing these component budgets together into a master budget provides an integrated view of a company’s finances. This helps managers make strategic decisions that align with financial objectives.
Who Prepares the Master Budget?
While the CEO and financial officers oversee budgeting, preparing the master budget is a collaborative effort:
- Financial analysts – Gather data needed for projections, run analysis, compile budgets
- Department managers – Provide detailed budget estimates for their units
- Controller – Oversees development and integration of all component budgets
- CFO – Reviews, approves, and presents final master budget
Input from all levels ensures the master budget is accurate and reflective of operational needs. Cross-departmental collaboration leads to better financial planning.
When is the Master Budget Prepared?
Most companies develop an annual master budget prior to the new fiscal year. Larger corporations may prepare master budgets quarterly or monthly.
Key timing considerations include:
- Length of budget period – Annual budgets cover 1 year; quarterly budgets cover 3 months
- Historical data – Past financial statements provide baseline figures to forecast from
- Economic conditions – Market trends inform revenue and cost projections
- Corporate calendar – Budgeting takes time, so start early before fiscal year begins
Leaving enough time to gather data, analyze past spending, and account for variables will result in the most accurate master budget.
How to Prepare a Master Budget in 7 Steps
Follow this step-by-step master budgeting process for optimal financial planning:
Step 1: Create a Sales Budget
Projected sales drive the master budget. Start by forecasting sales revenues:
-
Review past sales data – Look at seasonal and cyclical sales patterns over the past 5 years.
-
Factor in market conditions – Consider economic trends, competition, and industry outlook.
-
Make informed projections – Estimate future sales volume based on historical data and current/future market conditions.
-
Determine pricing – Multiply expected sales volume by planned prices per product/service.
The sales budget provides the foundation for the master budget. All other component budgets will build on the sales projections.
Step 2: Develop a Production Budget
Once sales are forecasted, determine the units that must be manufactured to meet sales goals:
-
Analyze sales budget – Review projections by product/service type.
-
Factor in desired ending inventory – Increase production to achieve ideal ending inventory levels.
-
Consider beginning inventory – Adjust for existing pre-produced inventory levels.
-
Determine units to produce – Calculate total units needed to meet projected sales and desired ending inventory.
Matching production output to expected sales ensures you can meet order demand. It also prevents excess inventory buildup.
Step 3: Create a Materials Budget
With production units estimated, forecast the direct materials needed for manufacturing:
-
Identify materials required – Determine types and quantities of materials used per unit produced.
-
Factor in desired ending inventory – Increase materials to maintain ideal inventory levels.
-
Consider beginning inventory – Reduce materials needed by what’s already on hand.
-
Project material purchases – Multiply units to be produced by required materials per unit.
This allows you to plan material purchases and costs accurately based on production needs.
Step 4: Develop a Direct Labor Budget
Project labor costs for workers directly involved in production:
-
Identify labor requirements – Determine direct labor hours per unit of output.
-
Factor in wage rates – Include hourly pay rates for each type of direct labor.
-
Calculate total labor hours – Multiply projected units by direct labor hours per unit.
-
Forecast labor costs – Multiply total labor hours by hourly pay rates for each labor type.
This provides insight into labor costs and hours so managers can plan staffing levels accordingly.
Step 5: Create an Overhead Budget
Estimate indirect production and operating costs:
-
List overhead costs – Utilities, equipment costs, rent, administrative salaries, marketing, R&D, etc.
-
Analyze past overhead – Look at overhead costs as a percentage of production or sales.
-
Project overhead costs – Use past overhead rates to estimate future indirect costs.
Budgeting for operating overhead ensures these expenses are accounted for in the master budget.
Step 6: Determine Cost of Goods Sold
Calculate your total per unit cost of production:
-
Add up costs – Direct materials, direct labor, and manufacturing overhead per unit.
-
Multiply by units – Cost per unit x total units produced.
Compare with sales revenues to analyze profit margin per product. This helps determine adequate pricing.
Step 7: Develop an Administrative Budget
Estimate general operating expenses:
-
List expenses – Payroll, supplies, utilities, accounting fees, etc.
-
Analyze past spending – Look at administrative expenses as a percentage of sales.
-
Project future expenses – Use past expense rates to forecast future administrative costs.
This captures general operating expenses not tied directly to production.
Bringing It All Together
Finally, integrate these component budgets to form a consolidated master budget:
- Compile all budgets into a single document
- Create a budgeted income statement and cash flow statement
- Include both monthly and annual projections
- Have department heads review for accuracy
- Make any necessary final revisions
- Secure approval from financial leadership
Following this detailed budgeting process will produce a complete, meaningful master budget to guide your organization’s financial decisions and strategic planning.
Tips for Effective Master Budgeting
Keep these tips in mind to prepare an accurate, useful master budget:
- Involve department managers in creating their budgets
- Compare budgets to past financial statements
- Build in conservative estimates and contingencies
- Plan budgets in good economic conditions and downturns
- Update budgets regularly as conditions change
- Use budgets to monitor performance vs. projections
- Tie budgets directly to business objectives
Advanced planning, collaboration, analysis, and follow-up are key to master budget success!
Benefits of Creating a Master Budget
Developing a comprehensive master budget provides many benefits:
- Guides strategic business decisions
- Enables cash flow control and planning
- Helps avoid cost overruns or revenue shortfalls
- Supports financing and funding requests
- Measures performance vs financial goals
- Forces departments to analyze operations and needs
- Reveals cost-reduction or revenue growth opportunities
In today’s uncertain economic environment, budgetary planning is more critical than ever. The master budget allows organizations to thoughtfully steer their financial course.
So follow this step-by-step guide to prepare integrated budgets that will keep your company on the path to profitability and long-term success. Smart financial planning through master budgeting leads to operational control and optimal performance.
3 The Master Budget
- Develop the components of a master budget.
Question: Developing a master budget is a lengthy process. Where do companies start when preparing a master budget?
Answer: Study Figure 9.1 “Master Budget Schedules” carefully, as it serves as the road map for the master budget presented throughout this chapter for Jerry’s Ice Cream. Notice that the budgeting process starts with the sales budget. Also, note that the budgets described next are for a manufacturing company. Manufacturing companies tend to have more budget schedules than other types of organizations because their operations are more complex. Once you understand budgeting in a manufacturing environment, you can easily modify the process to perform budgeting in other organizations, as discussed later in the chapter. As we work through the master budget for Jerry’s Ice Cream, assume the company prepares quarterly budgets.
Question: The sales budget is the starting point for the master budget, as shown in Figure 9.1 “Master Budget Schedules”. What is a sales budget, and how is it prepared?
Answer: The sales budgetAn estimate of units of product the organization expects to sell times the expected sales price per unit. is an estimate of units of product the organization expects to sell times the expected sales price per unit. This is perhaps the most important budget as it drives most of the other budgets. For example, the production budget and related materials, labor, and overhead budgets are based on expected sales.
Forecasting sales often involves extensive research and numerous sources. Companies, such as Jerry’s Ice Cream, typically start with their sales staff since salespeople have daily contact with customers and direct information about customer demand. Some companies pay for market trend data to learn about industry and product trends. Many organizations hire market research consultants to obtain and review industry data and ultimately to predict customer demand. Larger companies sometimes employ economists to develop sophisticated models used to project sales. Smaller, less sophisticated organizations simply base their estimates on past trends. Figure 9.2 “Estimating Sales” shows how companies obtain sales information from sales people, market research consultants, and economists.
Tom Benson, sales manager at Jerry’s Ice Cream, talked with his salespeople and reviewed market trends for ice cream using data obtained from a market research firm. His estimate, shown in Figure 9.3 “Sales Budget for Jerry’s Ice Cream”, assumes the company will increase sales 15 percent this coming year. Thus, to get projected sales for quarter 1, Tom simply multiplied last year’s first quarter sales by 1.15. The average price per unit last year was $6 (1 unit = 1 gallon), and Tom does not expect any change in this price. The sales budget is presented in Figure 9.3 “Sales Budget for Jerry’s Ice Cream”.
Figure 9.3 Sales Budget for Jerry’s Ice Cream
Question: The production budget is developed next and is based on sales budget projections. What is a production budget, and how is it prepared?
Answer: If the organization uses a just-in-time production system, where production occurs just in time to ship the products to the customer, units produced each quarter would be exactly the same as projected sales. However, most companies, including Jerry’s Ice Cream, maintain a certain level of finished goods inventory. Thus production is typically not the same as projected sales. The production budgetAn estimate of units to be produced, and it is based on sales projections plus an estimate of desired ending finished goods inventory less beginning finished goods inventory. is an estimate of units to be produced and is based on sales projections plus an estimate of desired ending finished goods inventory less beginning finished goods inventory, as summarized in the following:
Jerry’s Ice Cream plans to sell 40,000 units in the first quarter, as shown in Figure 9.3 “Sales Budget for Jerry’s Ice Cream”. For the sake of simplicity, assume work-in-process inventory is insignificant, and therefore beginning and ending work-in-process inventory is zero. (We assume beginning and ending work-in-process inventory is zero throughout this chapter.) The management prefers to maintain 10 percent of next quarter’s sales in ending inventory. Thus 4,800 units will be in inventory at the end of the first quarter (= 48,000 unit sales in second quarter × 10 percent). Units needed for the first quarter total 44,800 (= 40,000 unit sales + 4,800 units desired ending inventory). However, Jerry’s will not produce 44,800 units because inventory will be left over from the fourth quarter of last year. This beginning inventory will be 4,000 units (= 40,000 unit sales in first quarter × 10 percent). Thus actual production will total 40,800 units:
Figure 9.4 “Production Budget for Jerry’s Ice Cream” presents the production budget for each of the 4 quarters of the coming year. Examine this figure carefully, particularly the last line labeled units to be produced. Lynn Young, the production manager, will be concerned about the spike in production during the third quarter of 59,200 units. The third quarter, from July 1 through September 30, is the peak sales season for ice cream. It will be difficult for Lynn to plan for this increase in production from the first and second quarters to the third quarter. However, this is exactly why companies prepare budgets—to plan for the future!
Figure 9.4 Production Budget for Jerry’s Ice Cream
**Desired ending inventory = 10 percent × Next quarter sales; for the first quarter, 4,800 = 0.10 × 48,000. Fourth quarter desired ending inventory of 4,400 units is based on an estimate of sales in the first quarter of next year.
***Beginning inventory = Inventory at end of previous quarter; for example, second quarter beginning inventory = First quarter ending inventory.
Once Jerry’s Ice Cream knows how many units it must produce each quarter, budgets are established for the individual components of production: direct materials, direct labor, and manufacturing overhead. We present these budgets next.
Carol’s Cookies produces cookies for resale at grocery stores throughout North America. The company is currently in the process of establishing a master budget on a quarterly basis for this coming fiscal year, which ends December 31. Prior year quarterly sales were as follows (1 unit = 1 batch):
| First quarter | 64,000 units |
| Second quarter | 76,800 units |
| Third quarter | 96,000 units |
| Fourth quarter | 83,200 units |
Unit sales are expected to increase 25 percent, and each unit is expected to sell for $8. The management prefers to maintain ending finished goods inventory equal to 10 percent of next quarter’s sales. Assume finished goods inventory at the end of the fourth quarter budget period is estimated to be 9,000 units.
- Prepare a sales budget for Carol’s Cookies using a format similar to Figure 9.3 “Sales Budget for Jerry’s Ice Cream”. (Hint: be sure to increase last year’s unit sales by 25 percent.)
- Prepare a production budget for Carol’s Cookies using the format shown in Figure 9.4 “Production Budget for Jerry’s Ice Cream”.
Solution to Review Problem 9.3
- The following is a sales budget:

- The following is a production budget:
 *Desired ending inventory = 10 percent × Next quarter sales; for the first quarter, 9,600 = 0.10 × 96,000. Fourth quarter desired ending inventory of 9,000 units is given. **Beginning inventory = Inventory at end of previous quarter; for example, Second quarter beginning inventory = First quarter ending inventory.
Direct Materials Purchases Budget
Question: The number of units of finished goods to be produced each quarter from the production budget is the starting point for the direct materials purchases budget. What is a direct materials purchases budget, and how is it prepared?
Answer: The direct materials purchases budgetAn estimate of raw materials needed to achieve a desired level of production. is an estimate of raw materials needed to achieve a desired level of production. Figure 9.4 “Production Budget for Jerry’s Ice Cream”, the production budget, shows that 40,800 finished units will be produced in the first quarter. We will now establish a direct materials purchases budget that answers the questions: how many pounds of material must be purchased during the first quarter to achieve this production, and what is the cost of these materials?
Assume two pounds of material are required to produce one unit of product. Thus the amount of materials required to produce 40,800 units of ice cream is 81,600 pounds (= 40,800 units × 2 pounds per unit). This amount is labeled as materials needed in production in the direct materials purchases budget shown in Figure 9.5 “Direct Materials Purchases Budget for Jerry’s Ice Cream”. (To simplify this example, assume sugar is the only material used. However, other materials, such as cream and vanilla, are typically required to produce ice cream.)
Figure 9.5 Direct Materials Purchases Budget for Jerry’s Ice Cream
**Desired ending inventory = 20 percent × Next quarter production needs; for the first quarter, 19,680 = 0.20 × 98,400. Fourth quarter desired ending inventory of 20,000 pounds is based on an estimate of materials needed in production first quarter of next year.
***Beginning inventory = Inventory at end of previous quarter; for example, Second quarter beginning inventory = First quarter ending inventory.
****$2 direct materials cost per unit = 2 pounds of materials required per unit × $1 per pound.
Will the company buy 81,600 pounds of material in the first quarter? Probably not. Jerry’s will have materials in beginning raw materials inventory and prefers to maintain a certain level of ending raw materials inventory. Thus direct materials purchased is based on materials needed in production plus an estimate of desired ending raw materials inventory less beginning raw materials inventory. We summarize this in the following equation. Notice the similarity of this equation to the inventory equation presented earlier for the production budget.
Assume the management prefers to maintain raw materials ending inventory equal to 20 percent of next quarter’s materials needed in production. Thus 19,680 pounds of material will be in inventory at the end of the first quarter (= 98,400 pounds of materials needed in production in second quarter × 20 percent). Materials needed in inventory total 101,280 pounds (= 81,600 pounds of materials needed in production + 19,680 pounds of material in desired ending inventory). However, Jerry’s will not purchase 101,280 pounds of materials because inventory will be left over from the fourth quarter of last year. This beginning inventory will be 16,320 pounds (= 81,600 pounds of material needed in production in first quarter × 20 percent). Thus direct materials purchased in the first quarter will total 84,960 pounds:
To estimate the cost of purchasing 84,960 pounds of material, multiply the number of pounds to be purchased by the cost per pound. Assume the cost per pound of material for Jerry’s is $1. This results in a cost of $84,960 for materials to be purchased during the first quarter, as shown at the bottom of Figure 9.5 “Direct Materials Purchases Budget for Jerry’s Ice Cream” (= 84,960 pounds to be purchased × $1 per pound).
Review the direct materials purchases budget shown in Figure 9.5 “Direct Materials Purchases Budget for Jerry’s Ice Cream” carefully, particularly the line labeled direct materials to be purchased. The purchasing manager at Jerry’s Ice Cream uses this information, along with the price per pound, to negotiate the purchase of materials with suppliers.
Question: The direct materials purchases budget is the first of three supporting budgets for production. The second is the direct labor budget. What is the direct labor budget, and how is it prepared?
Answer: The direct labor budgetAn estimate of direct labor hours, and related cost, necessary to achieve a desired level of production. is an estimate of direct labor hours, and related costs, necessary to achieve a desired level of production. Knowing Jerry’s Ice Cream plans to produce 40,800 units of ice cream during the first quarter, this budget answers the questions: how many direct labor hours will be necessary to achieve this production, and what will this labor cost?
Assume it takes 0.10 direct labor hours (or 6 minutes) to produce 1 unit of product. Thus 4,080 hours of direct labor will be required to produce 40,800 units of product (= 40,800 finished units produced × 0.10 direct labor hours per unit). Given an average hourly rate of $13, the direct labor cost for the first quarter totals $53,040 (= 4,080 hours × $13 per hour). This information is shown in the direct labor budget presented in Figure 9.6 “Direct Labor Budget for Jerry’s Ice Cream”.
Figure 9.6 Direct Labor Budget for Jerry’s Ice Cream
**$1.30 direct labor cost per unit = 0.10 direct labor hours per unit × $13 per hour.
Carefully review the direct labor budget shown in Figure 9.6 “Direct Labor Budget for Jerry’s Ice Cream”. The production manager at Jerry’s Ice Cream, Lynn Young, uses this information to ensure the appropriate number of employees is available to meet production goals. Notice that the number of direct labor hours needed in production for the third quarter is significantly higher than each of the two previous quarters. Again, this is why organizations prepare budgets: to plan for these types of events. Lynn will have to start planning for this spike in direct labor hours, either by asking employees to work overtime or by hiring additional employees.
Question: The manufacturing overhead budget is the third of three supporting production budgets. What is a manufacturing overhead budget, and how is it prepared?
Answer: The manufacturing overhead budgetAn estimate of all production costs, other than direct materials and direct labor, necessary to achieve a desired level of production. is an estimate of all production costs, other than direct materials and direct labor, necessary to achieve a desired level of production. This budget is presented in Figure 9.7 “Manufacturing Overhead Budget for Jerry’s Ice Cream”. Notice that overhead costs are separated into variable and fixed components.
Figure 9.7 Manufacturing Overhead Budget for Jerry’s Ice Cream
**$1.20 = $240,480 total overhead cost ÷ 200,400 units to be produced for the year.
^Deduct depreciation to get the actual cash payment for overhead. This information is needed for the cash budget presented in Figure 9.11 “Cash Budget for Jerry’s Ice Cream”.
By definition, total variable overhead costs change with changes in production and are calculated by multiplying units to be produced by the cost per unit. For example, indirect materials cost for the first quarter of $6,120 is calculated by taking 40,800 units to be produced × $0.15 cost per unit. Fixed costs generally do not change with changes in production and therefore remain the same each quarter. (Note: In some situations, fixed overhead costs can change from one quarter to the next. For example, hiring additional salaried personnel during the year would increase fixed overhead costs, and purchasing equipment during the year would increase depreciation costs. In this example, we assume fixed overhead costs do not change during the year.)
Depreciation is deducted at the bottom of the manufacturing overhead budget to determine cash payments for overhead because depreciation is not a cash transaction. We use this information later in the chapter for the cash budget.
Carol’s Cookies, the company featured in the last review problem and in the next three, is now preparing the budget for direct materials purchases, direct labor, and manufacturing overhead.
Direct Materials Purchases Budget Information
Each unit of product requires 1.5 pounds of direct materials per unit, and the cost of direct materials is $2 per pound. Management prefers to maintain ending raw materials inventory equal to 30 percent of next quarter’s materials needed in production. Assume raw materials inventory at the end of the fourth quarter budget period is estimated to be 41,000 pounds.
Direct Labor Budget Information
Each unit of product requires 0.20 direct labor hours at a cost of $12 per hour.
Manufacturing Overhead Budget Information
Variable overhead costs are:
| Indirect materials | $0.20 per unit |
| Indirect labor | $0.15 per unit |
| Other | $0.35 per unit |
Fixed overhead costs each quarter are:
| Salaries | $28,000 |
| Rent | $22,000 |
| Depreciation | $16,165 |
Solution to Review Problem 9.4
-
 *Desired ending inventory = 30 percent × Next quarter production needs; for the first quarter, 44,280 = 0.30 × 147,600 pounds. Fourth quarter desired ending inventory of 41,000 pounds is given. **Beginning inventory = Inventory at end of previous quarter; for example, Second quarter beginning inventory = First quarter ending inventory. ***$3 direct materials cost per unit = 1.5 pounds of materials required per unit × $2 per pound.
 -
 *$2.40 direct labor cost per unit = 0.20 direct labor hours per unit × $12 per hour.
 -
 *$1.36 = $545,360 total overhead cost ÷ 401,000 units to be produced for the year. ^Deduct depreciation to get the actual cash payment for overhead. This information is needed for the cash budget prepared later.
The Master Budget
How do I prepare a Master Budget?
Preparing a master budget will require you to first prepare all of the smaller budgets, starting with the sales budget, since the numbers in your sales budget will directly affect the others. Before you begin preparing any budget, you’ll need to decide whether you’ll be preparing master budget components on a monthly or quarterly basis.
What is a Master budget & sales budget?
The master budget includes all the lower-level budgets, such as sales, production, marketing, and cash. The sales budget forecasts expected sales revenue for the budget period. It is based on historical sales data, market trends, and other relevant factors such as consumer behavior, economic conditions, and competition.
Why is preparing a Master budget so difficult?
External factors, such as changes in the market or unexpected events, can also pose a challenge when preparing a master budget. These factors can impact sales, production costs, and other key areas, making it difficult to create accurate projections. 7. Lack of Experience Preparing a master budget requires certain financial expertise.
What are the building blocks of a Master Budget?
The typical building blocks of a master budget include : Sales budget: The sales budget estimates how much of your product or service you expect to sell for the year, on a quarterly basis. This number should be informed by the macroeconomic environment as well as sales patterns from previous years, if available.
