A PERT chart is a useful tool for planning and managing complex projects. PERT stands for Program Evaluation and Review Technique. It is a project management technique designed to analyze the tasks involved in completing a project, especially the time needed to complete each task.
Creating a well-organized PERT chart enables you to optimize scheduling identify the critical path, and monitor project progress more effectively. Follow this comprehensive, step-by-step guide to learn how to make a PERT chart for your next project.
Step 1: Identify all project tasks and milestones
The first step in creating your PERT chart is to identify all the specific tasks and milestones that must be completed to finish your project
Break down the project into small manageable chunks, To determine the tasks
- Review the project scope, requirements, and deliverables
- Break down larger goals into granular subtasks
- Include steps for planning, execution, and delivery
- Add any handoffs between team members or departments
- Identify milestones marking key achievements
List each task and milestone in detail. You should end up with a comprehensive task list spanning the entire project lifecycle.
Step 2: Determine task dependencies and sequence
Next, analyze the dependencies between tasks to determine the optimal sequence.
- Which tasks can be completed concurrently vs. sequentially?
- Which tasks depend on others being completed first?
- Are there any overlaps between tasks or team members?
Mapping out task dependencies enables you to sequence them logically in the optimal order for efficiency.
Step 3: Estimate the expected time for each task
For each task, estimate the time duration expected to complete it. Several techniques can be used:
- Expert judgment – Consult knowledgeable team members for estimates.
- Past experience – Base estimates on data from completing similar tasks before.
- Three point estimates – Create optimistic, pessimistic, and most likely time scenarios.
- Simulation – Use Monte Carlo analysis to model time variations.
Also identify tasks that can be sped up or slowed down by allocating more or fewer resources.
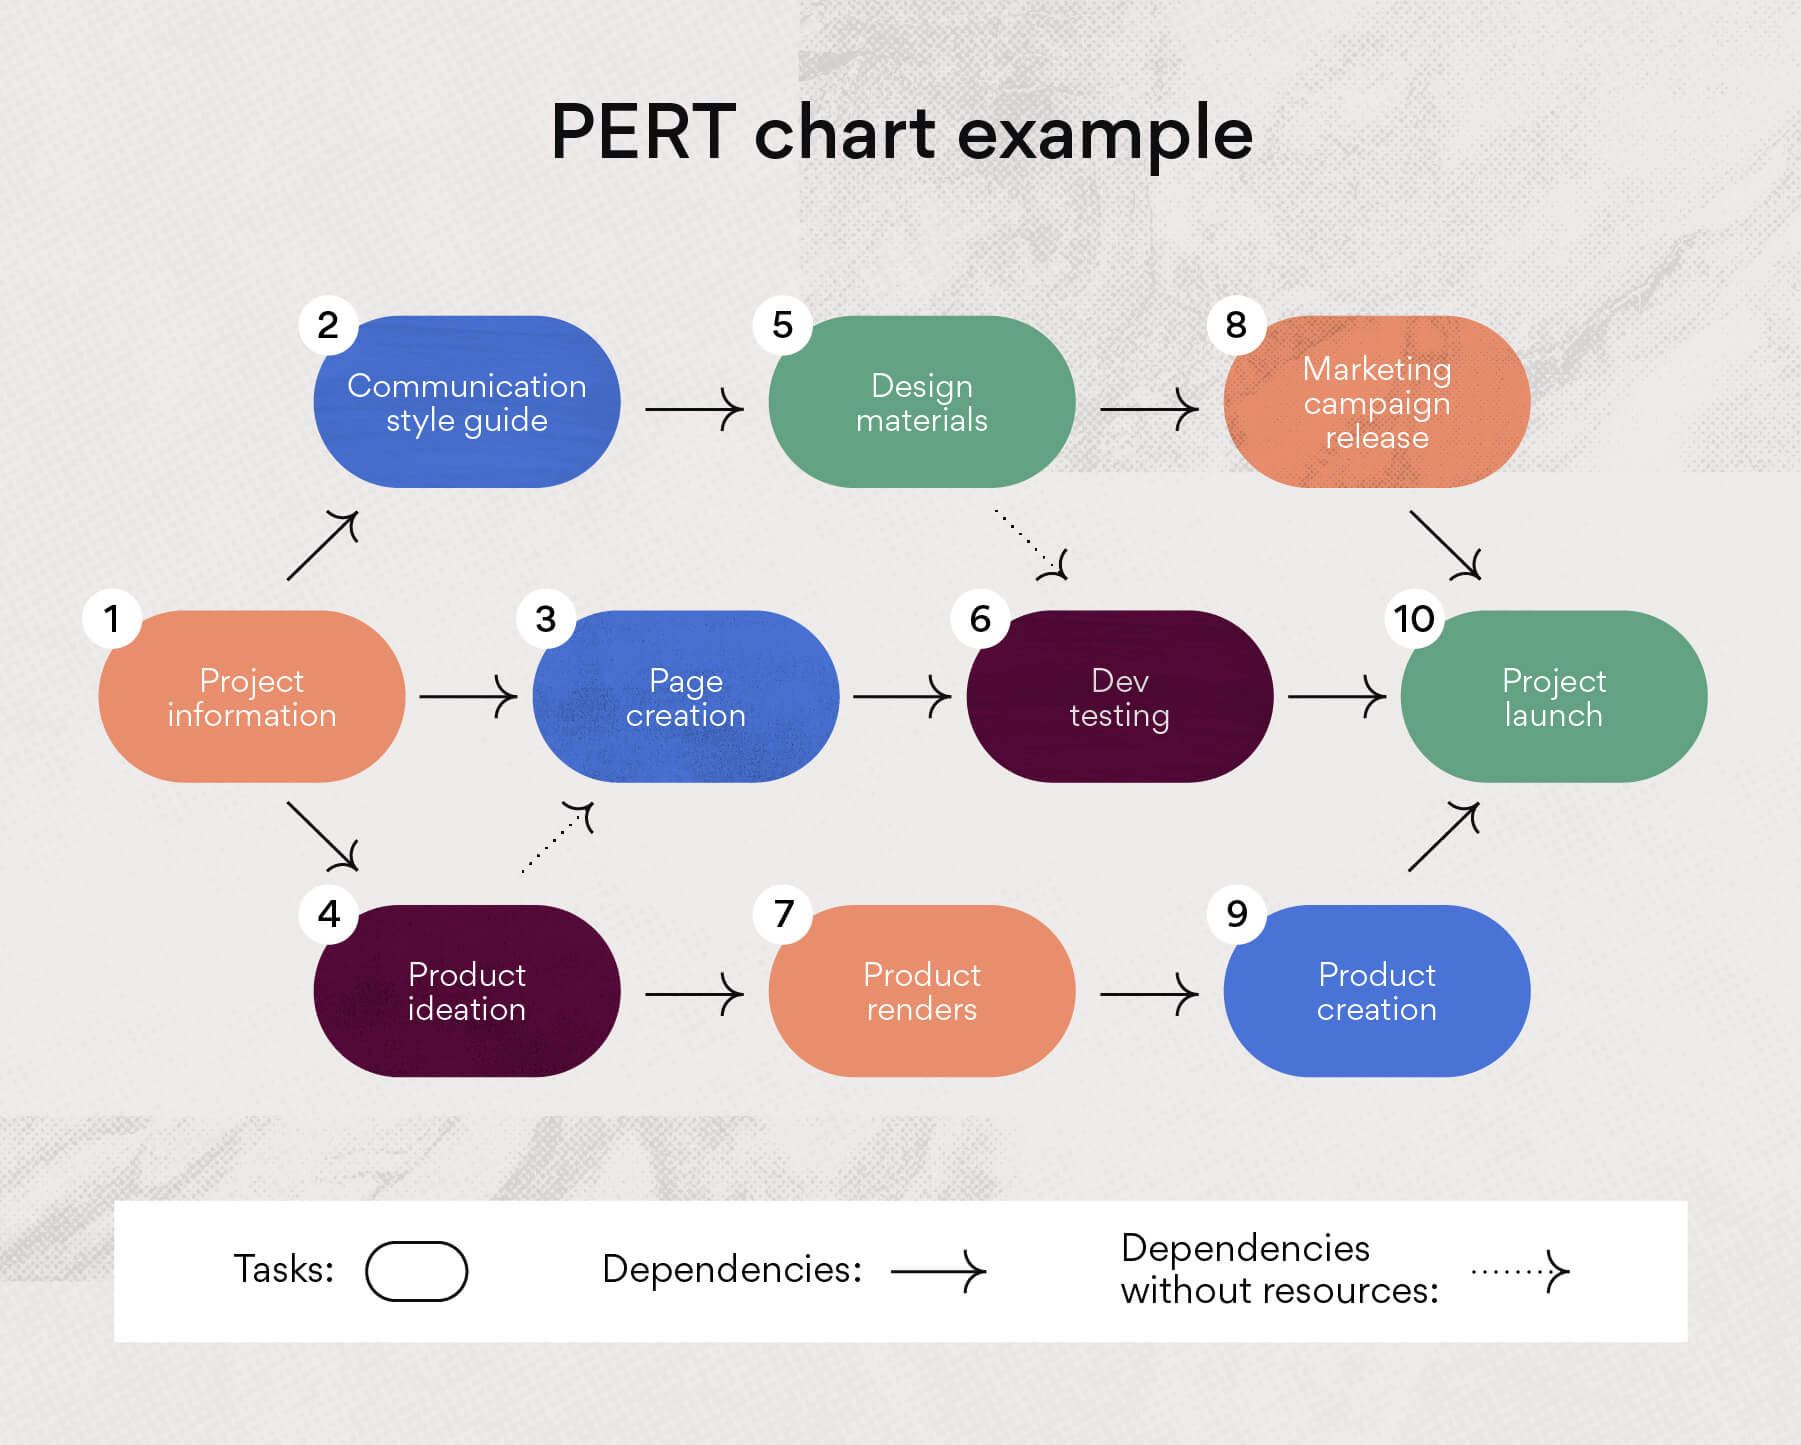
Step 4: Draw the chart
Now you’re ready to draw the actual PERT chart. Here are key elements to include:
- Nodes – Use circles or boxes to represent each task. Connect with lines showing sequence.
- Critical Path – Highlight the sequence of dependent tasks that determine the project timeframe.
- Time Estimates – Indicate the time duration in hours, days or weeks for each task.
- Milestones – Flag milestone events with diamonds, icons or callouts.
- Slack Time – Identify slack or float time between dependent tasks.
Organize the nodes logically from left to right. Position milestones chronologically. Allow space between tasks for slack time indicators. Use clear symbols and labels.
Step 5: Identify the project’s critical path
The critical path is the sequence of tasks that directly impact the project finish date. If delayed, the entire project timeline gets delayed.
To identify the critical path:
- Calculate the shortest possible completion time by adding the durations of the fastest sequence of dependent tasks.
- Compare against other dependent paths to determine which sequence directly dictates the project finish date.
- Highlight this path visually on the PERT chart.
Monitoring tasks on the critical path is especially important to avoid delays.
Step 6: Update the PERT chart as the project unfolds
A PERT chart is a living document that should be updated continually as the project progresses.
- Mark completed tasks as 100% finished.
- For tasks in progress, update % complete and time remaining.
- Reschedule tasks impacted by delays.
- Add and insert new tasks as needed.
- Rerun critical path analysis periodically.
Keeping the PERT chart current enables you to closely track actual vs planned progress and quickly address issues.
PERT charts provide a powerful way to plan projects, analyze task dependencies, identify critical paths, and monitor timelines. The 6 key steps include:
- List all tasks
- Map dependencies
- Estimate time durations
- Draw the chart
- Identify the critical path
- Update the chart regularly
Following this methodology helps project managers maintain control over complex initiatives involving many overlapping tasks and team members. A well-crafted PERT chart is an invaluable tool for executing projects effectively.
When Should I Use a PERT Chart?
Use PERT charts during the planning phase of a project. They can help you determine the project’s critical path and the ideal time to start or finish tasks, which allows you to know which tasks need to be prioritized when creating your project schedule.
As noted, PERT charts show the dependent tasks in your project. These are tasks that can’t start or finish until another task starts or finishes. Knowing which tasks are dependent helps you prevent delays by planning ahead to make sure these dependent tasks are scheduled in the order they need to be completed.
Use this free PERT Chart Template for Excel to manage your projects better.
Also, when planning a project, having an accurate forecast of its duration is crucial for resource scheduling. The PERT chart is a tool that can help you estimate the amount of time you’ll need to complete the project. It’s also very helpful when you’re working on more complex or larger projects.
Disadvantages of Using PERT Charts for Project Management
PERT charts aren’t a quick fix to get your projects magically on track, though. Naturally, bad data in results in bad data out. It’s important that the person conducting the PERT analysis has experience in the process.
They’re also labor intensive, which some organizations might not have the time or money to invest in. Additionally, you don’t build a PERT and call it a day. They require continuous reviews and updates to make sure they’re accurate. If you’re using a PERT chart template, you’ll have to create many versions of it.
How to Create a Pert Chart – Project Management Training
How to create a PERT Chart?
By now, you might have understood that a PERT chart is a must-have for project managers in the planning phase of the project. Here are the steps to create a PERT chart: Step 1: Start by identifying the project milestones and break them into individual tasks. Step 2: Next, understand the task sequence as well as their dependencies.
What do the arrows on a PERT Chart mean?
The arrows on a PERT chart represent the tasks or activities that need to be completed before the team can move on to the next event or phase in the project. The task between nodes 1 and 2 (“identify market segment”) is a directional or concurrent arrow in the mockup above. This indicates the task must be completed in the sequence indicated.
What is the difference between LucidChart & PERT Chart?
Lucidchart is a visual workspace that combines diagramming, data visualization, and collaboration to accelerate understanding and drive innovation. A PERT chart, based on the Project Evaluation Review Technique, is a project management tool used to visualize a project’s key milestones and overall timeline.
