As an Excel user, you may have heard about the Data Analysis Toolpak – an incredibly useful set of data analysis tools available in Excel. But if you haven’t loaded and installed it, you won’t be able to access all that analytical power.
Not to worry! Getting the Data Analysis Toolpak up and running only takes a couple quick steps. In this article, I’ll walk you through everything you need to know to start taking advantage of Excel’s built-in data analysis capabilities.
Why Use the Data Analysis Toolpak?
The Data Analysis Toolpak provides a wide variety of tools to help you analyze your raw data. Here are just some of the ways it can help:
-
Statistical analysis – The Toolpak includes tools for regression, correlation, analysis of variance (ANOVA), and many other common statistical tests. No more translating your data into specialized statistical software!
-
Engineering analysis – You also get tools for Fourier analysis, moving averages, and other techniques commonly used in engineering and science.
-
Ease of use – Each tool walks you through a dialog box where you specify your desired analysis and input ranges. Results are output to a new worksheet, making interpretation seamless.
-
Charts and reports – Many tools will optionally output charts and summary reports along with the raw statistical results.
-
Data mining – Predictive tools like exponential smoothing and moving averages help uncover patterns and trends in your datasets
In short, the Data Analysis Toolpak brings a wide range of analytical power to Excel users. Even if you also use dedicated statistical packages like R or SPSS, it can supplement your analyses.
Determine If You Already Have the Toolpak
Before going through the steps to load the Toolpak, it’s worth checking if you already have access to it:
- Click on the Data tab in Excel.
- In the Analysis group, click Data Analysis.
If you see a list of analysis tools, great! The Toolpak is already installed. If not, it will prompt you to install it.
Step 1: Load the Analysis Toolpak Add-in
Excel add-ins like the Analysis Toolpak are stored files that add functionality to the program. The first step is to load the Toolpak add-in:
- In Excel, go to File > Options.
- In the Excel Options menu, click Add-ins on the left.
- In the Manage field at the bottom, select Excel Add-ins from the dropdown menu.
- Click Go to bring up the Add-Ins dialog box.
This will display the currently installed add-ins. To load the Analysis Toolpak:
- Check the box next to Analysis ToolPak.
- Click OK to load it.
If Analysis Toolpak is not listed in the Add-Ins available box:
- Click Browse to locate it on your computer.
- Click OK after browsing to the file location.
The Analysis Toolpak add-in will now be loaded every time you open Excel. Next, we need to install it.
Step 2: Install the Analysis Toolpak
Once loaded, the Analysis Toolpak may still need to be fully installed onto your computer before it can be used.
If you receive a prompt that the Analysis Toolpak is not currently installed when loading it, simply click Yes to install.
If it does not prompt you, try to access the Toolpak:
- In Excel, go to the Data tab.
- In the Analysis group, click Data Analysis.
If you receive a prompt that the Toolpak needs to be installed, click OK to complete the installation.
And that’s it! The Analysis Toolpak will now be enabled each time you open Excel. Let’s look at how to access all those useful data analysis tools.
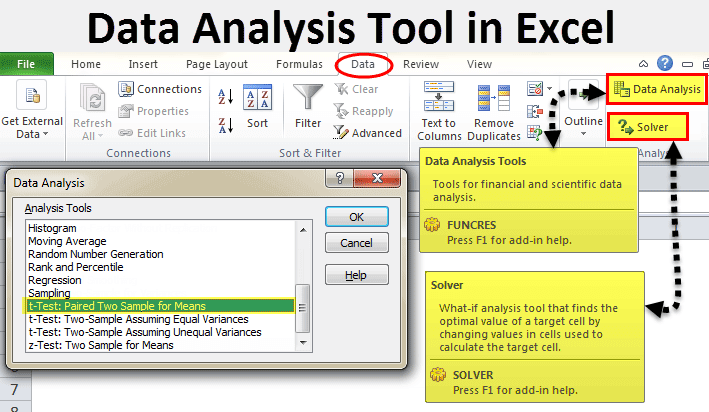
Accessing the Data Analysis Tools
With the Data Analysis Toolpak fully loaded and installed, you can now:
- Go to the Data tab in Excel.
- Click Data Analysis in the Analysis group.
This will open the Data Analysis dialog box, listing all of the available tools:
![Data Analysis Dialog Box][]
From here, you can select whichever tool you need for your analysis task. The Toolpak provides the following categories of tools:
- Statistical – Descriptive statistics, correlations, regressions, etc.
- Forecasting – Exponential smoothing, moving average, etc.
- Engineering – Fourier analysis, regression tools, etc.
- Compatibility – Tools from older versions of Excel.
Scroll through the list to see all the available tools. When you click on a tool, it will take you through a dialog box specific to that tool to input your data ranges and analysis parameters.
Tips for Using the Data Analysis Tools
Now that you have access to all these powerful tools, here are some tips to use them effectively:
- Get to know what each analysis tool does before using it. Understanding the methodology will help you choose the right tool and interpret your results.
- Organize your raw data in tables separate from your analysis output. Tools will output results on a new worksheet or existing output table.
- Take advantage of the optional charts and summary reports generated by some tools. The visual components make interpreting the analytical results easier.
- The tools can be used on only one data table/worksheet at a time. You’ll need to rerun analysis on additional data sets.
- If a tool seems to be “missing,” try installing the Analysis ToolPak – VBA add-in, which unlocks additional functions.
Mastering the Data Analysis Toolpak does take some learning. But the wide range of analytical capabilities it unlocks makes it well worth the effort for any Excel power user.
Troubleshooting Issues with the Toolpak
In some cases, you may run into issues getting the Analysis Toolpak properly loaded and installed. Here are some troubleshooting tips:
- Ensure you have administrative rights to install add-ins on your computer. Your IT department may need to assist.
- Some corporate security policies block Excel add-in installation. Again, talk to IT to allowlist the Toolpak.
- If not prompted to install, access the Data Analysis dialog box (Data > Data Analysis). The install prompt should appear.
- Try manually re-installing the Toolpak (.xla or .xlam file) from the Microsoft Download Center.
- Ensure your Excel version supports add-ins. Nearly all do from Office 2007 onward, but legacy versions may not.
- Disable other add-ins and retry loading the Analysis Toolpak solo to check for conflicts.
In most cases, following the steps outlined in this article will get the Toolpak successfully up and running. But if you continue to face issues, your system or security policies may require additional tweaks to permit full installation.
Expand Your Analytical Powers with the Data Analysis Toolpak
As you can see, enabling Excel’s Data Analysis Toolpak requires just a few quick steps – but unlocks a vast array of analytical potential. From basic statistical tests to advanced predictive models, it puts immense data analysis capabilities right at your fingertips in Excel.
While learning to master all the tools does take practice, the simple access makes the Toolpak an invaluable asset for any data analyst’s toolkit.
So take these steps to load and install this often under-utilized Excel add-in. You’ll wonder how you ever analyzed data without it! The Data Analysis Toolpak can evolve your basic Excel data crunching into truly insightful analytical explorations.
How do I enable the Data Analysis Toolpak in Excel (Windows & Mac)?
Go to the support documentation for up-to-date instructions.
- Open Excel.
- Click on the File menu.
- At the bottom of the menu that pops up, click on Options.
- In the Excel Options box that opens up, click the Add-Ins tab.
- At the bottom of the window, click the Go… button.
- Check the box next to Analysis Toolpak. Click OK.
You can access the Data Analysis Toolpak under the Data tab of Excels Ribbon menu bar.
How to Install the Data Analysis Tool in Excel
How does a data analysis tool work?
You provide the data and parameters for each analysis, and the tool uses the appropriate statistical or engineering macro functions to calculate and display the results in an output table. Some tools generate charts in addition to output tables.
How do I access data analysis tools in Excel?
To access these tools, click Data Analysis in the Analysis group on the Data tab. If the Data Analysis command is not available, you need to load the Analysis ToolPak add-in program. Need more help? You can always ask an expert in the Excel Tech Community or get support in Communities.
How do I add a Data Analysis Toolpak to excel?
The Data Analysis ToolPak is added from the Office menu. Step 1: Click the “Office” button at the top left (with the Microsoft logo) and then click “Excel Options.” Step 2: Next, click “Add-Ins,” then select “Excel Add-Ins” in the Manage box. Step 3: Click “Go,” then click the “Analysis ToolPak” check box.
How do I recalculate data analysis in Excel?
To perform data analysis on the remainder of the worksheets, recalculate the analysis tool for each worksheet. Click the File tab, click Options, and then click the Add-Ins category. In the Manage box, select Excel Add-ins and then click Go. If you’re using Excel for Mac, in the file menu go to Tools > Excel Add-ins.
