Being able to calculate slope is an essential skill for performing regression analysis and modeling linear relationships in Excel Slope indicates the steepness of a line and the relationship between two variables
In this comprehensive guide, you’ll learn multiple methods to find slope in Excel using functions, charts, and formulas.
What is Slope?
Slope is a measure of the steepness of a straight line and defined as the change in Y divided by the change in X between two points on a line. It can be positive, negative, zero, or undefined.
The slope of a line tells us:
- The incline – Higher positive slopes are steeper uphill lines, while large negative slopes are steeper downhill lines. A slope of zero means a horizontal line.
- The relationship between variables – The slope shows the relationship between changes in X and Y. For example, if X is time and Y is distance traveled, the slope would represent speed.
Knowing the slope allows you to calculate Y values for a given X value using the slope-intercept formula:
Y = Slope * X + Intercept
Where slope is the “m” and intercept is the “b” value. Now let’s go over the various ways to find slope in Excel.
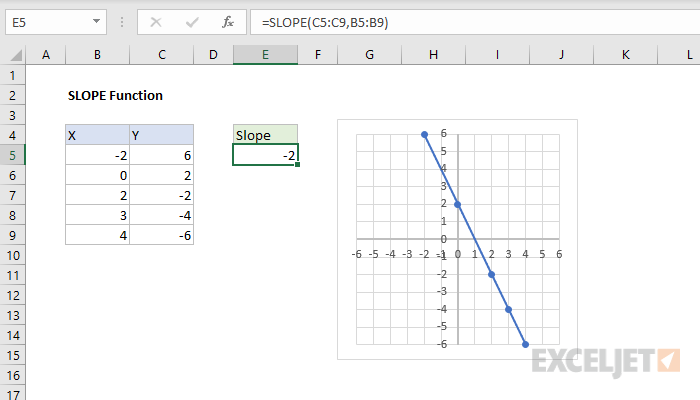
Method 1: Use the SLOPE Function
The simplest way to find slope in Excel is using the pre-made SLOPE function. Just input your X and Y data ranges.
SLOPE Function Format:
=SLOPE(known_y’s, known_x’s)
For example:
=SLOPE(B2:B11, A2:A11)This returns the slope of the line formed by the XY coordinate pairs in those ranges.
The SLOPE function automatically does the linear regression calculation in the background.
Key Notes on SLOPE:
- X values go in the second argument, Y values in the first
- Returns #DIV/0! error if only one data point
- Ignores text values, counts empty cells as 0
You can also find the y-intercept using the INTERCEPT function, giving you the full slope-intercept equation.
Method 2: Use the Slope Formula
If you want to see the math behind computing slope, you can use the slope formula directly in Excel.
Slope Formula:
(Total Sum of X*Y – (Sum of X * Sum of Y) / n) / (Total Sum of X^2 – (Sum of X)^2 / n)
Where n is the number of data points.
It looks complex, but can be replicated in Excel:
=(SUM(x*y) - SUM(x)*SUM(y)/COUNT(x)) / (SUM(x^2) - SUM(x)^2/COUNT(x))Plug in your X and Y ranges to get the slope value.
While more work than the SLOPE function, you can see how the slope is derived algebraically.
Method 3: Add a Trendline to Scatter Chart
For a visual representation, insert a scatter chart with your X and Y data, then add a linear trendline.
To find slope from a trendline:
-
Create a scatter chart with X and Y data
-
Right click the dots, select “Add Trendline”
-
In Format Trendline pane, check “Display Equation on Chart”
-
Slope is the number next to “x” in the equation
The benefit of using a chart trendline is seeing the best fit line overlaid on the plot, giving context to the slope value.
You can also display the R-squared value and customize the trendline.
Method 4: Use the LINEST Function
LINEST is an array function that performs full linear regression analysis. It returns key regression statistics, including the slope and y-intercept.
LINEST Function Format:
=LINEST(known_y’s, [known_x’s], [const], [stats])
Where:
- known_y’s = Y data range
- known_x’s = optional X data range
- const = logical value for intercept calculation
- stats = logical value for regression statistics
For example:
=LINEST(B2:B11,A2:A11,TRUE,TRUE)This returns an array with the slope in the first cell and intercept as the second cell.
LINEST is great when you need regression statistics from data. But for just the slope use SLOPE or trendlines.
Method 5: Use the FORECAST Function
FORECAST calculates the Y value for a given X based on existing X and Y data using linear regression. The slope is inherent in its calculation.
FORECAST Format:
=FORECAST(x, known_y’s, known_x’s)
Where:
- x = X value to predict Y for
- known_y’s = Y data range
- known_x’s = X data range
For example:
=FORECAST(15, B2:B11, A2:A11) Returns the predicted Y when X=15.
You can prove it uses the same slope value as other methods by predicting multiple Y’s at different X’s and calculating slope from the coordinates.
Method 6: Find Slope of Exponential/Logarithmic Data
In addition to linear data, you may need to find slope for exponential or logarithmic relationships.
For exponential:
Take the log of the Y and X data, then find the slope of the linearized log values. Raise e to the power of that slope.
For logarithmic:
Take the log of just the Y data, then find the slope based on the log Y and original X.
These transformations linearize the curves, allowing slope calculation.
Key Things to Remember About Slope:
- Slope represents the change in Y over change in X
- Positive slope means Y increases as X increases
- Negative slope means Y decreases as X increases
- Slope close to 1 is approx. a 45 degree angle
- Slope of 0 means perfectly horizontal line
- Use SLOPE or trendlines unless advanced regression needed
Learning to find slope quickly unlocks regression analysis and modeling capabilities for business forecasting, predictions, and more in Excel.
How to Use Slope in Excel : MS Excel Tips
How to calculate Trendline slope in Excel?
Follow these simple steps: Identify the range of X and Y values for which you want to calculate the slope. Enter the Excel formula ‘=SLOPE (Y values, X values)’ in the desired cell, replacing ‘Y values and X values’ with the corresponding ranges of cells in your data table. The result will be the slope of your trendline.
What is slope function in Excel?
The SLOPE function on Excel graphs measures the slope of the line between two sets of data points. However, this slope will not always be indicative of the predicted value trend. For instance, if there is not a linear relationship between the X and Y data points, the slope calculation will be unreliable.
How do I find a slope in Excel?
A quicker way to find the slope in Excel is to use Excel’s Trendline feature. Here are the steps to do it: Select the data points you want to use to create a trendline graph. Click on the ‘Insert’ tab at the top of the screen.
How to calculate slope of a line using a function?
The function relates to the method for calculating a line’s steepness and inclination. The function uses x and y coordinates points along the line to determine the slope of the lines. Let’s use the function to determine the slope in our chart. Steps: To begin with, type the formula in C12. Hence, we get our desired slope of the line.
