For companies large and small, properly calculating variable expenses is a key component of financial planning and analysis. Unlike fixed costs which remain constant, variable expenses fluctuate based on production volume and sales. Understanding how to accurately estimate and track variable costs enables stronger forecasting budgeting and ensuring profitability across production cycles.
In this comprehensive guide we’ll explore what variable expenses are how to calculate them, and how they impact financial projections and operations. Mastering variable cost analysis positions your company for greater financial control and optimal decision making.
What Are Variable Expenses?
Variable expenses are costs that change in relation to production volume They are tied directly to sales and output As production increases or decreases, variable expenses rise and fall correspondingly.
Common examples of variable costs include:
- Raw materials
- Packaging supplies
- Sales commissions
- Production wages
- Inventory delivery fees
These costs vary based on how many products are manufactured. Fixed costs like rent, utilities, salaries, and insurance remain constant regardless of production.
Accurately separating variable vs. fixed expenses is crucial for proper financial analysis. Let’s look at techniques for calculating variable costs.
Calculating Variable Expenses: Key Formulas
Here are three key formulas for calculating variable expenses:
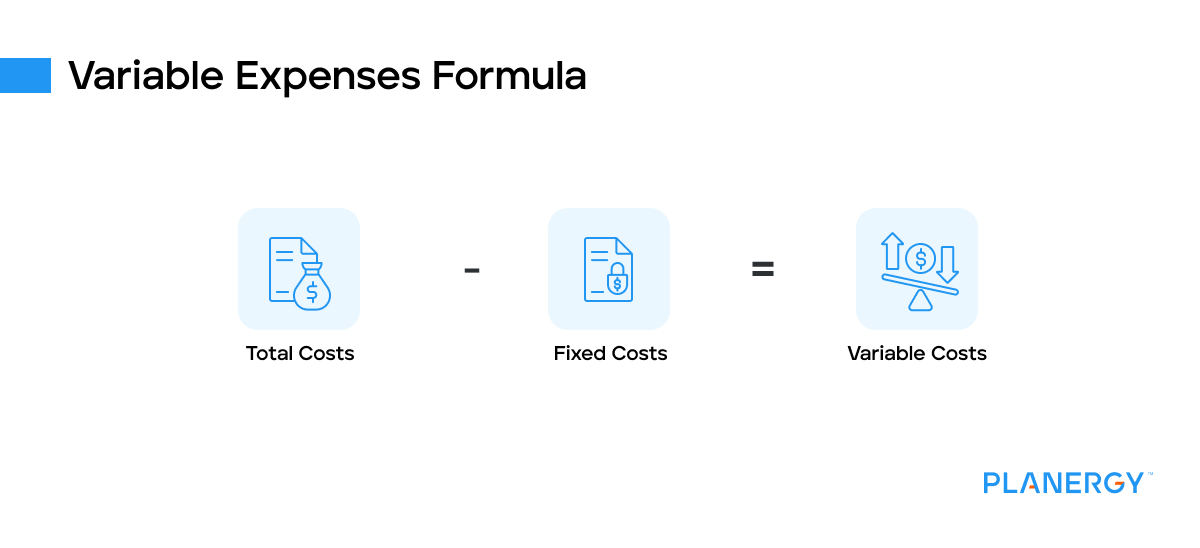
1. Variable Costs = Total Costs – Fixed Costs
This simple formula derives variable costs based on a company’s total costs minus the fixed portion.
Total costs – Fixed costs = Variable costs
To use this formula, analysts need accurate categorization of the two cost types.
2. Variable Costs = Units Produced x Cost Per Unit
This formula calculates variable costs based on production volume multiplied by the variable cost per unit.
Units produced x Cost per unit = Variable costs
The cost per unit is based on direct material and labor needed to produce each individual unit.
3. Variable Cost % = Variable Costs / Total Costs
This formula expresses variable costs as a percentage of total costs.
Variable costs / Total costs = Variable cost %
The percentage indicates how much of the total cost structure is variable vs. fixed.
Let’s look at an example that applies these key variable cost formulas.
Variable Expense Calculation Example
Let’s calculate variable expenses for a furniture manufacturer.
- Annual fixed costs are $200,000
- 10,000 chairs were produced
- The material cost per chair is $15
- The labor cost per chair is $25
Using formula #1:
- Total costs = Fixed costs + Variable costs
- Total costs = $200,000 + Variable costs
Using formula #2:
- Units produced = 10,000
- Cost per unit = $15 (materials) + $25 (labor) = $40
- Variable costs = Units x Cost per unit
= 10,000 x $40 = $400,000
Plugging back into formula #1:
- $200,000 + Variable costs = Total costs
- $200,000 + $400,000 = $600,000 in total costs
Finally, using formula #3:
- Variable costs = $400,000
- Total costs = $600,000
- Variable cost % = $400,000 / $600,000 = 67%
So for this company, variable expenses comprise 67% of total costs.
Why Calculate Variable Expenses?
Tracking variable costs accurately serves several important purposes:
Budgeting – Quantifying variable expenses improves budgets and cost projections across production cycles.
Profitability metrics – Isolating variable costs leads to more accurate unit costs, margins, and breakeven analysis.
Operating leverage – Identifying the mix of fixed vs. variable expenses impacts risk and profitability.
Volume planning – Understanding variable cost fluctuations helps plan appropriate production volumes.
Pricing – Accurate variable unit costs enable setting prices to achieve profit goals.
Efficiency – Monitoring variable cost trends spots inefficiencies in materials, labor, or methods.
Thorough variable cost analysis provides crucial insights for production planning, budgets, pricing, and overall financial control.
How to Forecast Variable Expenses
When projecting variable costs, analysts model how expenses will fluctuate across production scenarios. Key steps include:
-
Use historical data – Start by collecting variable cost data over past production cycles.
-
Analyze trends – Identify when variable costs increased or decreased and what key drivers caused the change.
-
Model scenarios – Create flexible forecasts showing variable costs at different production levels.
-
Add growth factors – Factor in how costs for materials, labor, or other variables may rise beyond production volume changes.
-
Compare to actuals – After the fact, compare forecasts vs. actual variable costs incurred. Tweak models to improve accuracy.
-
Control overhead – Look for variable overheads like utilities that may act more like fixed costs and optimize accordingly.
Sharp variable expense forecasting only comes with practice over many iterations. The payoff is more accurate budgets and flexibility in planning for fluctuating production needs.
Variable Cost Drivers: Materials, Labor, Overhead
There are three primary drivers of variable costs to analyze:
Direct material costs – The materials that comprise a finished product will directly vary based on production volume. Understanding pricing and volume discounts is crucial.
Direct labor costs – The worker wages required in the production process will scale up or down with production volume. Learning where excess labor exists is key.
Variable overhead – Overhead costs like utilities may have both fixed and variable components. Allocating overhead accurately is vital.
Within these major categories, businesses must identify specific cost drivers for their unique operations. The more granular the analysis, the better expense forecasts will become.
Avoiding Common Variable Cost Mistakes
Some common pitfalls to avoid when calculating variable expenses:
- Categorizing costs incorrectly as fixed or variable
- Using last year’s flawed data without adjustment
- Failing to account for indirect variable costs
- Not adjusting for known price increases
- Assuming variable costs increase linearly versus analyzing at different volume levels
- Focusing only on total costs versus cost per unit
- Relying on percentages versus unit-level analysis
Advanced variable cost analysis requires a diligent focus on accuracy, details, and exploring each underlying cost driver.
Software Tools for Variable Cost Analysis
Sophisticated software tools can streamline the process of tracking and projecting variable costs. Options to explore include:
Spreadsheets – Microsoft Excel allows modeling variable cost formulas across customizable production scenarios.
Accounting systems – Integrated accounting systems like NetSuite track cost details including reporting on variable expenses.
Business intelligence – BI tools provide deep data analysis to uncover trends and cost optimization opportunities.
Budgeting software – Dedicated budgeting platforms allow flexible forecasting of fluctuating production costs.
Technology solutions enable more automated, real-time, and accessible variable cost analysis. The right tools fit each company’s budget, needs, and existing tech stack.
Key Takeaways for Managing Variable Expenses
Mastering variable cost analysis delivers a powerful advantage for production planning, forecasting, and cost optimization. Key takeaways include:
- Quantify how costs change in relation to production volume
- Classify expenses correctly into fixed vs. variable buckets
- Understand specific cost drivers for materials, labor, and overhead
- Use formulas to calculate variable costs based on production scenarios
- Continuously improve forecasting accuracy based on past data
- Leverage technology to add automation and sophistication
- Avoid common errors like linear cost assumptions
Developing expertise in variable cost analysis provides tremendous financial control as production needs fluctuate. Find ways to continually improve your variable cost management over time.
Understanding Variable Costs
The total expenses incurred by any business consist of variable and fixed costs. Variable costs are dependent on production output or sales. The variable cost of production is a constant amount per unit produced. As the volume of production and output increases, variable costs will also increase. Conversely, when fewer products are produced, the variable costs associated with production will consequently decrease.
Examples of variable costs are sales commissions, direct labor costs, cost of raw materials used in production, and utility costs.
Variable costs are usually viewed as short-term costs as they can be adjusted quickly. For example, if a company is having cash flow issues, it may immediately decide to alter production to not incur these costs.
Example of a Variable Cost
Let’s assume that it costs a bakery $15 to make a cake—$5 for raw materials such as sugar, milk, and flour, and $10 for the direct labor involved in making one cake. The table below shows how the variable costs change as the number of cakes baked varies.
|
1 cake |
2 cakes |
7 cakes |
10 cakes |
0 cakes |
|
|
Cost of sugar, flour, butter, and milk |
$5 |
$10 |
$35 |
$50 |
$0 |
|
Direct labor |
$10 |
$20 |
$70 |
$100 |
$0 |
|
Total variable cost |
$15 |
$30 |
$105 |
$150 |
$0 |
As the production output of cakes increases, the bakery’s variable costs also increase. When the bakery does not bake any cake, its variable costs drop to zero.
Fixed costs and variable costs comprise the total cost. Total cost is a determinant of a company’s profits, which is calculated as:
A company can increase its profits by decreasing its total costs. Since fixed costs are more challenging to bring down (for example, reducing rent may entail the company moving to a cheaper location), most businesses seek to reduce their variable costs. Decreasing costs usually means decreasing variable costs.
If the bakery sells each cake for $35, its gross profit per cake will be $35 – $15 = $20. To calculate the net profit, the fixed costs have to be subtracted from the gross profit. Assuming the bakery incurs monthly fixed costs of $900, which includes utilities, rent, and insurance, its monthly profit will look like this:
| Number Sold | Total Variable Cost | Total Fixed Cost | Total Cost | Sales | Profit |
| 20 Cakes | $300 | $900 | $1,200 | $700 | $(500) |
| 45 Cakes | $675 | $900 | $1,575 | $1,575 | $0 |
| 50 Cakes | $750 | $900 | $1,650 | $1,750 | $100 |
| 100 Cakes | $1,500 | $900 | $2,400 | $3,500 | $1,100 |
A business incurs a loss when fixed costs are higher than gross profits. In the bakery’s case, it has gross profits of $700 – $300 = $400 when it sells only 20 cakes a month. Since its fixed cost of $900 is higher than $400, it would lose $500 in sales. The break-even point occurs when fixed costs equal the gross margin, resulting in no profits or losses. In this case, when the bakery sells 45 cakes for a total variable cost of $675, it breaks even.
A company that seeks to increase its profit by decreasing variable costs may need to cut down on fluctuating costs for raw materials, direct labor, and advertising. However, the cost cut should not affect product or service quality as this would have an adverse effect on sales. By reducing its variable costs, a business increases its gross profit margin or contribution margin.
The contribution margin allows management to determine how much revenue and profit can be earned from each unit of product sold. The contribution margin is calculated as:
Contribution Margin = G r o s s P r o f i t S a l e s = ( S a l e s − V C ) S a l e s where: V C = Variable Costs begin{aligned} &text{Contribution~Margin} = dfrac{Gross~Profit}{Sales}=dfrac{ (Sales-VC)}{Sales}\&textbf{where:}\&VC = text{Variable Costs}\ end{aligned} Contribution Margin=SalesGross Profit=Sales(Sales−VC)where:VC=Variable Costs
The contribution margin for the bakery is ($35 – $15) / $35 = 0.5714, or 57.14%. If the bakery reduces its variable costs to $10, its contribution margin will increase to ($35 – $10) / $35 = 71.43%. Profits increase when the contribution margin increases. If the bakery reduces its variable cost by $5, it would earn $0.71 for every dollar in sales.
