The fixed asset turnover (FAT) ratio is an important financial metric that measures how efficiently a company utilizes its fixed assets to generate sales. This ratio essentially compares the net sales figure on the income statement to the fixed assets figure on the balance sheet.
In this comprehensive guide, we will walk through the step-by-step process of calculating the fixed asset turnover ratio. We will also look at the interpretation, limitations, and examples of this ratio. Let’s get started!
What is the Fixed Asset Turnover Ratio?
The fixed asset turnover ratio shows how well a company is using its fixed assets to produce sales. Fixed assets like property, plant and equipment are used to conduct business operations and generate revenue. The FAT ratio specifically measures the efficiency of these long-term tangible assets.
A high fixed asset turnover ratio implies that the company is generating substantial sales from its existing fixed assets. It indicates that management is efficiently utilizing the company’s investments in plant property and equipment to drive revenues.
On the flip side, a low FAT ratio suggests that the company is not fully utilizing its fixed asset capacity to generate sales. It signals excessive investment in fixed assets relative to the sales being produced from those assets
The FAT ratio is especially useful for analyzing manufacturing companies and other capital-intensive businesses that rely heavily on fixed assets for operations. However, it can provide insight into any company that carries fixed assets on its balance sheet.
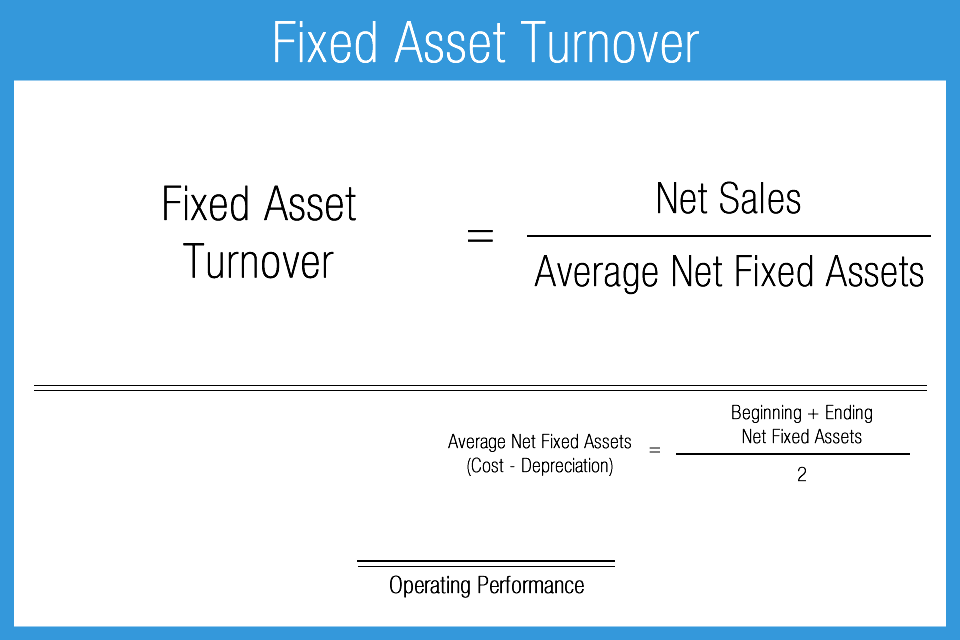
Fixed Asset Turnover Ratio Formula
The formula to calculate fixed asset turnover ratio is:
Fixed Asset Turnover = Net Sales / Average Fixed Assets
Where:
-
Net Sales = Total sales revenue minus returns, discounts, and allowances
-
Average Fixed Assets = (Beginning fixed assets + Ending fixed assets) / 2
Let’s break this formula down step-by-step:
Step 1: Determine Net Sales
Start by identifying the net sales figure from the company’s income statement. Net sales represent total sales revenue minus any returns, discounts, and allowances. This is the top-line sales number that the company actually earned after factoring in returns and markdowns.
Step 2: Calculate Average Fixed Assets
Next, we need to calculate the average fixed assets for the period. Locate the fixed assets balances from the beginning and end of the period on the company’s balance sheet. Fixed assets are generally reported as property, plant and equipment, net of accumulated depreciation.
Add the beginning and ending fixed asset balances together. Then divide this total by 2 to obtain the average fixed assets for the period.
Step 3. Plug in to Formula
Finally, plug the net sales and average fixed assets figures into the formula:
Fixed Asset Turnover = Net Sales / Average Fixed Assets
And calculate the ratio.
Example of Fixed Asset Turnover Ratio
Let’s calculate the fixed asset turnover ratio for ABC Company using the income statement and balance sheet data below:
- Net sales for 2020 = $550,000
- Fixed assets on 1/1/2020 = $200,000
- Fixed assets on 12/31/2020 = $250,000
Step 1: Net sales figure is $550,000
Step 2: Average fixed assets = ($200,000 + $250,000) / 2 = $225,000
Step 3: Fixed Asset Turnover Ratio = $550,000 / $225,000 = 2.44x
ABC Company’s fixed asset turnover ratio is 2.44x for 2020. This means the company generated $2.44 in sales for every $1 invested in fixed assets.
Interpreting the Fixed Asset Turnover Ratio
So what does this ratio tell us? Here are some guidelines on interpreting fixed asset turnover:
-
A higher ratio is preferable, as it indicates greater efficiency in generating sales from fixed assets. However, there is no definitive “good” number for this ratio.
-
Compare the ratio to competitors and industry averages to contextualize performance. The average FAT ratio varies widely across industries.
-
Monitor trends over time. Look for improving efficiency by comparing the current ratio to historical ratios. A declining ratio could signal excessive fixed asset investments.
-
Use alongside other metrics like ROI and ROA to evaluate profitability of fixed asset investments. The FAT ratio only considers sales, not profits.
-
Consider factors like outsourcing, business cycles, and capacity utilization that could impact the ratio.
Overall, utilize the fixed asset turnover ratio as a tool to assess operational efficiency and guide strategic decisions around fixed asset investments.
Limitations of the Fixed Asset Turnover Ratio
While useful, the FAT ratio has some limitations to keep in mind:
-
It ignores profitability and only considers sales productivity of fixed assets. A company could have a high turnover but low margins.
-
It does not account for intangible assets that may contribute significantly to sales.
-
Extremely high ratios can indicate overutilization of assets and potential underinvestment.
-
Outsourcing production can artificially inflate the ratio by reducing fixed assets.
-
It can vary significantly across industries, limiting comparability. Capital-intensive businesses tend to have lower ratios.
-
Changes in accounting policies like depreciation methods can impact fixed asset balances used in the ratio.
To overcome these limitations, analysts often use the fixed asset turnover ratio together with other metrics to conduct a comprehensive assessment of performance.
Examples of Fixed Asset Turnover Ratio
Let’s look at some examples to better understand how to calculate and interpret this important ratio:
Example 1
Company A has:
- Net sales of $100 million
- Average fixed assets of $60 million
Fixed Asset Turnover Ratio = $100 million / $60 million = 1.67x
Example 2
Company B has:
- Net sales of $200 million
- Average fixed assets of $100 million
Fixed Asset Turnover Ratio = $200 million / $100 million = 2x
Comparing Company A and B, we can see that Company B has a higher fixed asset turnover ratio. This indicates it is generating more sales per dollar of investment in fixed assets than Company A.
Assuming these companies operate in the same industry, Company A likely has room to improve operational efficiency to catch up with Company B.
Example 3
Company C has:
-
2020 net sales of $500 million
-
2020 average fixed assets of $200 million
-
2019 net sales of $450 million
-
2019 average fixed assets of $180 million
Company C’s fixed asset turnover ratio is:
2020 FAT Ratio = $500 million / $200 million = 2.5x
2019 FAT Ratio = $450 million / $180 million = 2.5x
Company C has maintained the same fixed asset turnover ratio from 2019 to 2020. This indicates it has scaled sales proportionately with fixed asset investments over this period.
Key Takeaways
-
The fixed asset turnover ratio measures the efficiency of fixed asset usage to generate sales.
-
It is calculated by dividing net sales by average fixed assets.
-
A higher ratio indicates more effective utilization of fixed assets.
-
Compare the ratio to past trends, competitors, and industry benchmarks.
-
Use limitations of the metric to analyze alongside other ratios for a complete view.
-
Regularly monitor the FAT ratio to guide strategic capital allocation and operating decisions.
The fixed asset turnover is a useful productivity metric for businesses to optimize their fixed assets and make sound investment decisions. By following this comprehensive guide on calculating and interpreting the FAT ratio, you can readily apply it in financial statement analysis.
Fixed Asset Turnover Ratio
What is fixed asset turnover ratio?
Based on the given figures, the fixed asset turnover ratio for the year is 9.51, meaning that for every dollar invested in fixed assets, a return of almost ten dollars is earned. The average net fixed asset figure is calculated by adding the beginning and ending balances, and then dividing that number by 2.
How do you calculate fixed asset turnover?
Fixed Asset Turnover = Net Sales / (Gross Fixed Assets – Accumulated Depreciation) In the above formula, the net sales represent the total sales made and the revenue generated form it after taking away any discounts, allowances or returns. It is also called the top line of the income statement.
What is a standard asset turnover ratio?
The standard asset turnover ratio considers all asset classes including current assets, long-term assets, and other assets. A common variation of the asset turnover ratio is the fixed asset turnover ratio. Instead of dividing net sales by total assets, the fixed asset turnover divides net sales by only fixed assets.
What is fixed asset turnover (fat)?
Fixed Asset Turnover (FAT) is an efficiency ratio that indicates how well or efficiently a business uses fixed assets to generate sales. This ratio divides net sales by net fixed assets, calculated over an annual period. The net fixed assets include the amount of property, plant, and equipment, less the accumulated depreciation.
