A confidence interval, in statistics, refers to the probability that a population parameter will fall between a set of values for a certain proportion of times. Analysts often use confidence intervals that contain either 95% or 99% of expected observations. Thus, if a point estimate is generated from a statistical model of 10.00 with a 95% confidence interval of 9.50 to 10.50, it means one is 95% confident that the true value falls within that range.
Statisticians and other analysts use confidence intervals to understand the statistical significance of their estimations, inferences, or predictions. If a confidence interval contains the value of zero (or some other null hypothesis), then one cannot satisfactorily claim that a result from data generated by testing or experimentation is to be attributable to a specific cause rather than chance.
A confidence interval is a range of values that is likely to contain the true value of an unknown population parameter. Confidence intervals are commonly constructed for statistics like means, proportions, and regression coefficients.
Calculating a confidence interval allows you to quantify the uncertainty in your estimate. This guide will walk you through the step-by-step process of calculating confidence intervals using sample data. We’ll cover everything you need to determine the confidence level, select the right formula, calculate margins of error, and interpret your results.
What is a Confidence Interval?
A confidence interval provides a range of plausible values for an unknown population parameter. The range is calculated from a sample statistic and factors in the uncertainty involved in using a sample to estimate a population.
For example, suppose the mean price of wheat is unknown because you can’t measure the entire population. However, you collect a random sample of wheat prices. The sample mean provides a point estimate of the unknown population mean. But that point estimate is unlikely to equal the actual population mean exactly.
This is where confidence intervals come in. They create a range around the sample statistic to convey the precision of the estimate. Narrow confidence intervals indicate a precise estimate, while wide intervals indicate an imprecise estimate.
The confidence level tells you how often the process used to construct the intervals results in ranges that contain the true parameter value. For 95% confidence intervals 95% of the calculated intervals contain the true parameter.
Select the Confidence Level
The first step is choosing your confidence level, which is the long-run probability that the confidence interval contains the parameter.
Typical confidence levels are 90% 95% and 99%. Levels of 90% and 95% are most common since they provide a balance between precision and confidence. Higher levels produce wider intervals, while lower levels increase the risk that the range will not contain the parameter.
For many applications, a 95% confidence level works well. Use your knowledge of the subject matter to decide if a different level is warranted.
Determine the Sample Statistic
Next, calculate the sample statistic that will serve as the point estimate. This is generally the mean, proportion, regression coefficient, etc. that you want to create the confidence interval around.
Make sure to calculate this value using the correct formulas. For example, the sample mean is the sum of the observations divided by the sample size.
Accurately determining this statistic is crucial because it serves as the midpoint of the confidence interval. An incorrect point estimate will shift the entire range.
Find the Critical Value
The critical value depends on your confidence level and degrees of freedom. It sets the width of the confidence interval.
For confidence intervals based on normal distributions, use the z-critical value. Find this in a z-table by looking up the z-score associated with your confidence level. For a 95% CI, the z-score is 1.96.
For small samples or unknown population standard deviations, use a t-critical value instead. Look this up in a t-table using your confidence level and degrees of freedom.
Online calculators can also provide these critical values. Just input your specifications.
Calculate the Margin of Error
The margin of error determines the width of the confidence interval. It measures the maximum amount that the sample statistic is likely to differ from the population parameter.
To find it, multiply the critical value by the standard error. The standard error measures the accuracy of the sample statistic. Its formula depends on the type of statistic you’re evaluating.
For example, the standard error of the mean is the sample standard deviation divided by the square root of the sample size.
So for a 95% CI, the margin of error is 1.96 * (sample standard deviation / √sample size).
A larger sample size reduces the standard error, tightening the confidence interval.
Construct the Confidence Interval
With the critical value, standard error, and sample statistic, you’re ready to calculate the confidence interval.
The formulas differ slightly based on the statistic, but generally you will:
- Take your sample statistic
- Subtract the margin of error
- And add the margin of error
This creates a range with the sample statistic in the middle.
For example, a confidence interval for a mean with a sample mean of 50, MOE of 5, and 95% confidence level would be:
(50 – 5) to (50 + 5)
45 to 55
So you can be 95% confident the true mean lies between 45 and 55.
Interpret Your Confidence Interval
Keep these tips in mind when interpreting your calculated confidence interval:
-
Wider ranges indicate less precision in the estimate. Narrow ranges reflect more precision.
-
The confidence level applies to the process/methodology. There is no way to know if an individual interval contains the true parameter.
-
Changing the confidence level widens or narrows the interval. Higher confidence levels produce wider ranges.
-
Increasing the sample size usually tightens the interval by reducing the margin of error.
-
Confidence intervals indicate plausibility, not certainty. Other plausible values likely exist outside the range.
Properly interpreting confidence intervals requires understanding their capabilities and limitations. Avoid mistaking them for proofs or guarantees.
Confidence Interval Example
Let’s walk through an example to tie all these steps together.
A study collects a random sample of 100 widgets. The sample mean weight is 3.5 grams with a standard deviation of 1 gram. Construct a 95% confidence interval for the mean weight of all widgets produced.
Step 1) Select the confidence level
We’ll use the standard 95% confidence level.
Step 2) Calculate the sample statistic
The sample mean is 3.5 grams. This is our point estimate.
Step 3) Determine the critical value
With a 95% CI and 100 observations, we will use the z-critical value of 1.96.
Step 4) Find the margin of error
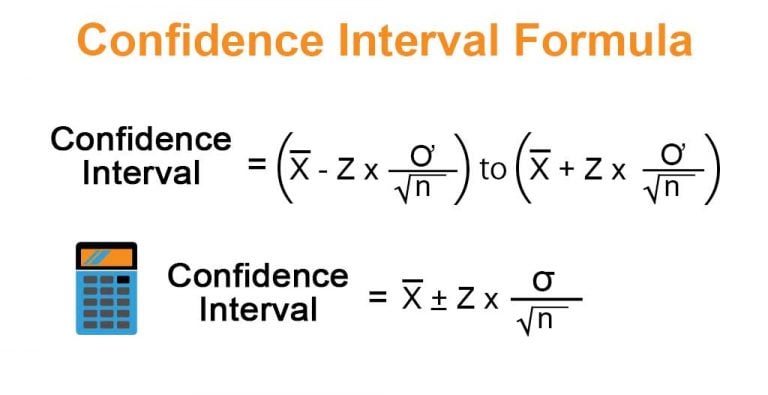
The standard error of the mean is σ/√n. That’s 1 gram / √100 = 0.1 gram.
Margin of error is 1.96 * 0.1 = 0.196 gram.
Step 5) Construct interval
Lower bound: 3.5 – 0.196 = 3.304 grams
Upper bound: 3.5 + 0.196 = 3.696 grams
Step 6) Interpret interval
We can be 95% confident that the true average widget weight in the population lies between 3.304 grams and 3.696 grams. The range is reasonably precise given the small margin of error.
And that’s it! By following this process, you can construct accurate confidence intervals and properly evaluate the results. Confidence intervals are useful tools for quantifying the uncertainty in your parameter estimates computed from sample data.
Frequency of Entities:
scribbr.com: 1
statisticsbyjim.com: 1
confidence interval: 21
confidence level: 6
confidence intervals: 7
sample: 11
population: 8
parameter: 10
margin of error: 5
standard error: 4
critical value: 5
sample statistic: 6
interpret: 3
calculate: 5
step: 7
example: 2
percent: 2
range: 5
estimate: 5
width: 2
unknown: 2
contains: 3
true: 5
value: 6
likely: 1
construct: 2
sample size: 3
point estimate: 3
precision: 4
plausible: 2
random sample: 1
quantify: 1
uncertainty: 2
statistics: 1
Calculating Confidence Intervals
Suppose a group of researchers is studying the heights of high school basketball players. The researchers take a random sample from the population and establish a mean height of 74 inches.
The mean of 74 inches is a point estimate of the population mean. A point estimate by itself is of limited usefulness because it does not reveal the uncertainty associated with the estimate; you do not have a good sense of how far away this 74-inch sample mean might be from the population mean. Whats missing is the degree of uncertainty in this single sample.
Confidence intervals provide more information than point estimates. By establishing a 95% confidence interval using the samples mean and standard deviation, and assuming a normal distribution as represented by the bell curve, the researchers arrive at an upper and lower bound that contains the true mean 95% of the time.
Assume the interval is between 72 inches and 76 inches. If the researchers take 100 random samples from the population of high school basketball players as a whole, the mean should fall between 72 and 76 inches in 95 of those samples.
If the researchers want even greater confidence, they can expand the interval to 99% confidence. Doing so invariably creates a broader range, as it makes room for a greater number of sample means. If they establish the 99% confidence interval as being between 70 inches and 78 inches, they can expect 99 of 100 samples evaluated to contain a mean value between these numbers.
A 90% confidence level, on the other hand, implies that you would expect 90% of the interval estimates to include the population parameter, and so forth.
What Is a T-Test?
Confidence intervals are conducted using statistical methods, such as a t-test. A t-test is a type of inferential statistic used to determine if there is a significant difference between the means of two groups, which may be related to certain features. Calculating a t-test requires three key data values. They include the difference between the mean values from each data set (called the mean difference), the standard deviation of each group, and the number of data values of each group.
How To…Calculate the Confidence Interval for a Sample
How do you calculate a confidence interval?
To calculate a confidence interval around the mean of data that is not normally distributed, you have two choices: You can find a distribution that matches the shape of your data and use that distribution to calculate the confidence interval.
What is a confidence interval?
A confidence interval is the mean of your estimate plus and minus the variation in that estimate. This is the range of values you expect your estimate to fall between if you redo your test, within a certain level of confidence. Confidence, in statistics, is another way to describe probability.
How do you calculate a 95% confidence interval?
To calculate the 95% confidence interval, we can simply plug the values into the formula. For the USA: So for the USA, the lower and upper bounds of the 95% confidence interval are 34.02 and 35.98. For GB: So for the GB, the lower and upper bounds of the 95% confidence interval are 33.04 and 36.96.
How do you find the confidence interval for a population proportion?
Let p′ represent the sample proportion, x n, where x represents the number of successes and n represents the sample size. Let q′ = 1– p′. Then the confidence interval for a population proportion is given by the following formula: (lower bound, upper bound) = (p ′ − EBP, p ′ + EBP) = (p ′ − z√p q n, p ′ + z√p q n)
