Understanding how a variable changes over time is key in many real-world situations The average rate of change measures the average change between two points on a function or data set, But how exactly do you calculate it?
In this comprehensive guide, we’ll walk through what average rate of change represents, explain the step-by-step calculation, and look at example problems using the formula
What is Average Rate of Change?
The average rate of change measures how fast a function’s output is changing over some interval, on average. It is defined as the change in the function’s output divided by the change in input between two points.
For a function f(x), the average rate of change between points (a, f(a)) and (b, f(b)) is:
Average Rate of Change = (f(b) - f(a)) / (b - a)Where f(a) and f(b) are the function’s outputs at points a and b.
This measures how fast the function output is changing per unit change in input, on average, between the two points.
Average rate of change has many real-world applications. For example, it can calculate the average speed on a trip based on total distance traveled and time elapsed. Or the average temperature change per hour.
Next, we’ll walk through the step-by-step process to calculate average rate of change.
How to Calculate Average Rate of Change in 4 Steps
Follow these 4 key steps to calculate the average rate of change between two points on a function:
Step 1) Find the inputs and outputs of the two points
To start, identify the x and y values for the two points on the function. Usually these will be given in the problem.
For example, say we have the points (2, 5) and (8, 11) on some function f(x). Here:
- Point 1: x1 = 2, y1 = f(2) = 5
- Point 2: x2 = 8, y2 = f(8) = 11
Step 2) Take the difference in outputs
Subtract the y-value of point 1 from the y-value of point 2 to find the change in outputs.
In our example:
Change in outputs = y2 - y1 = 11 - 5 = 6This shows the function’s output increased by 6 between the points.
Step 3) Take the difference in inputs
Subtract the x-value of point 1 from the x-value of point 2 to find the change in inputs.
For our points:
Change in inputs = x2 - x1 = 8 - 2 = 6The input changed by 6 units between the points.
Step 4) Divide change in outputs by change in inputs
Finally, divide the change in outputs by the change in inputs to get the average rate of change:
Average Rate of Change = (y2 - y1) / (x2 - x1) = 6 / 6 = 1Therefore, the average rate of change between the points is 1. On average, the function output is increasing by 1 for each unit increase in input.
And that’s it – follow those 4 steps to easily calculate average rate of change for any two points on a function!
Example Average Rate of Change Problems
Let’s look at some example problems to clearly understand how to apply the average rate of change formula:
Example 1
Find the average rate of change of the function f(x) = 2x + 3 between the points (1, 5) and (4, 14).
Solution
Point 1: x1 = 1, y1 = f(1) = 5
Point 2: x2 = 4, y2 = f(4) = 14
Change in outputs = 14 – 5 = 9
Change in inputs = 4 – 1 = 3
Average rate of change = 9/3 = 3
Therefore, the average rate of change between the points is 3.
Example 2
A car trip took 3 hours and the total distance traveled was 180 miles. Find the average speed.
Solution
Let d(t) be the distance function where t is time.
Point 1: t1 = 0, d(0) = 0
Point 2: t2 = 3, d(3) = 180
Change in outputs (distances) = 180 – 0 = 180
Change in inputs (time) = 3 – 0 = 3
Average rate of change (average speed) = 180/3 = 60 mph
So the average speed over the 3 hour trip was 60 mph.
Key Takeaways for Average Rate of Change
-
Average rate of change measures how fast a function’s output changes on average between two inputs.
-
It is calculated by finding the change in output divided by the change in input between two points.
-
Applications include finding average speed, temperature change, interest rates, and more.
-
Using the 4 step process makes calculating average rate of change straightforward.
Understanding average rate of change allows you to analyze how quickly a dependent variable is changing over time on average. Follow the steps outlined here to easily find the average rate of change for any function or real-world data set.
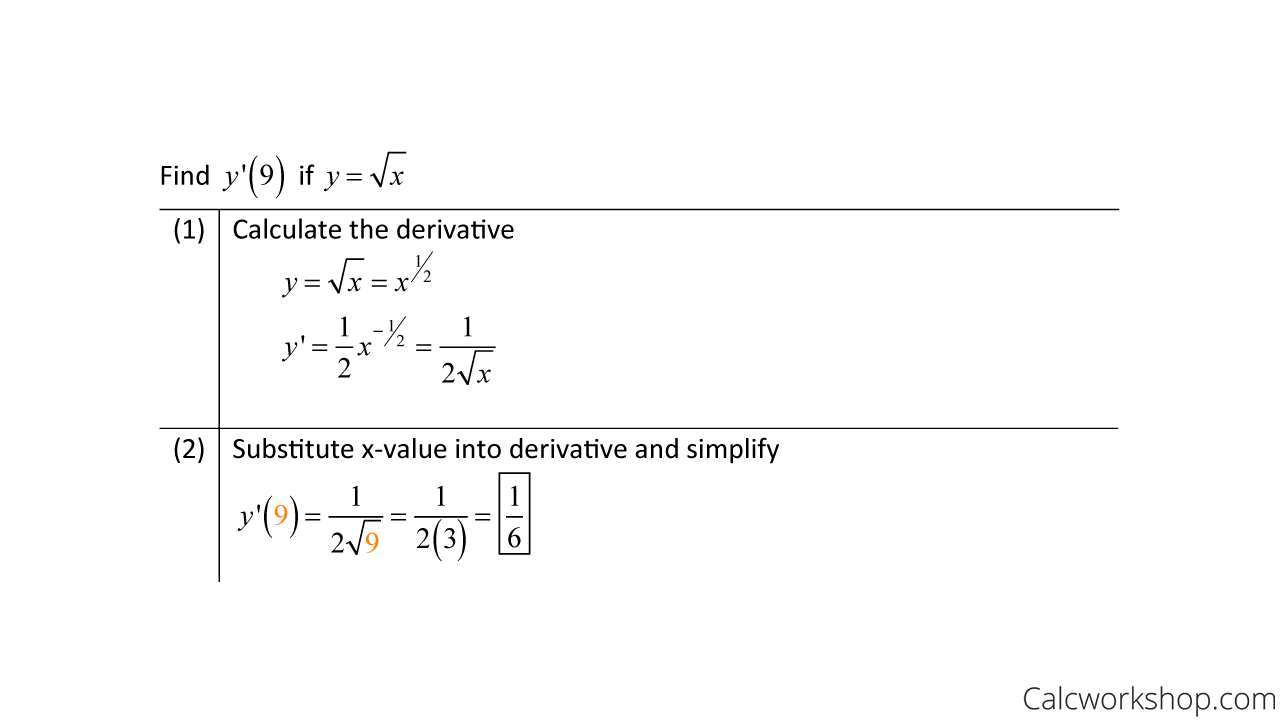
How To Find Instantaneous Rate Of Change
All we have to do is take the derivative of our function using our derivative rules and then plug in the given x-value into our derivative to calculate the slope at that exact point.
For example, let’s find the instantaneous rate of change for the following functions at the given point.
Average Vs Instantaneous Rate Of Change
But now this leads us to a very important question.
What is the difference is between Instantaneous Rate of Change and Average Rate of Change?
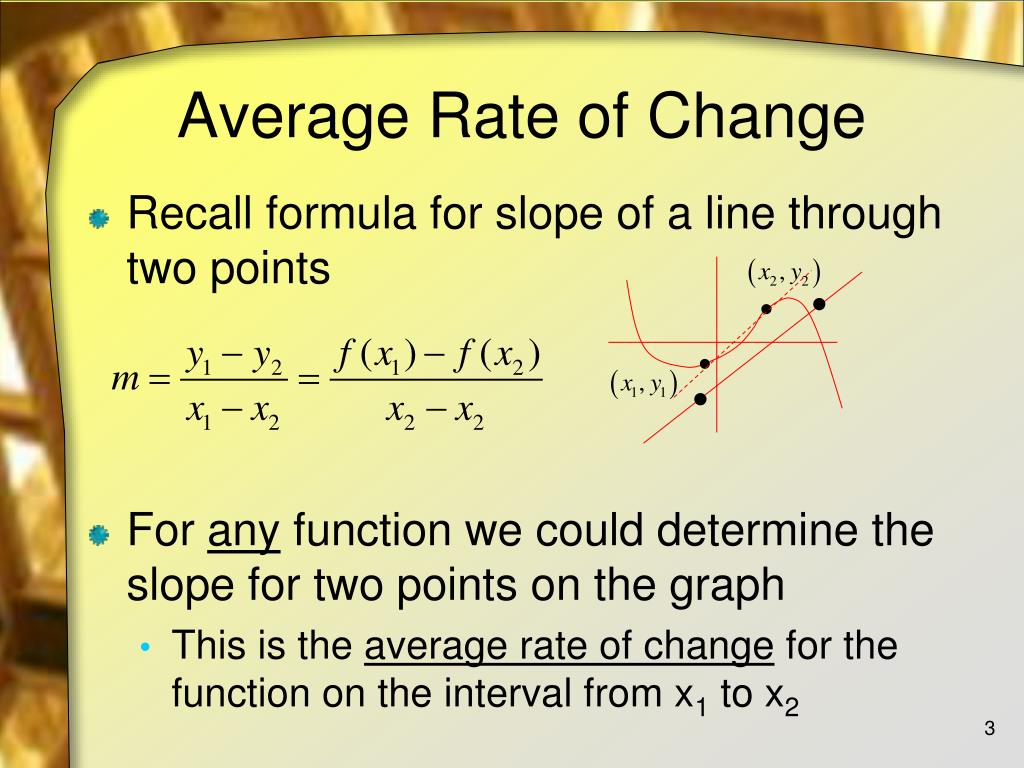
While both are used to find the slope, the average rate of change calculates the slope of the secant line using the slope formula from algebra. The instantaneous rate of change calculates the slope of the tangent line using derivatives.
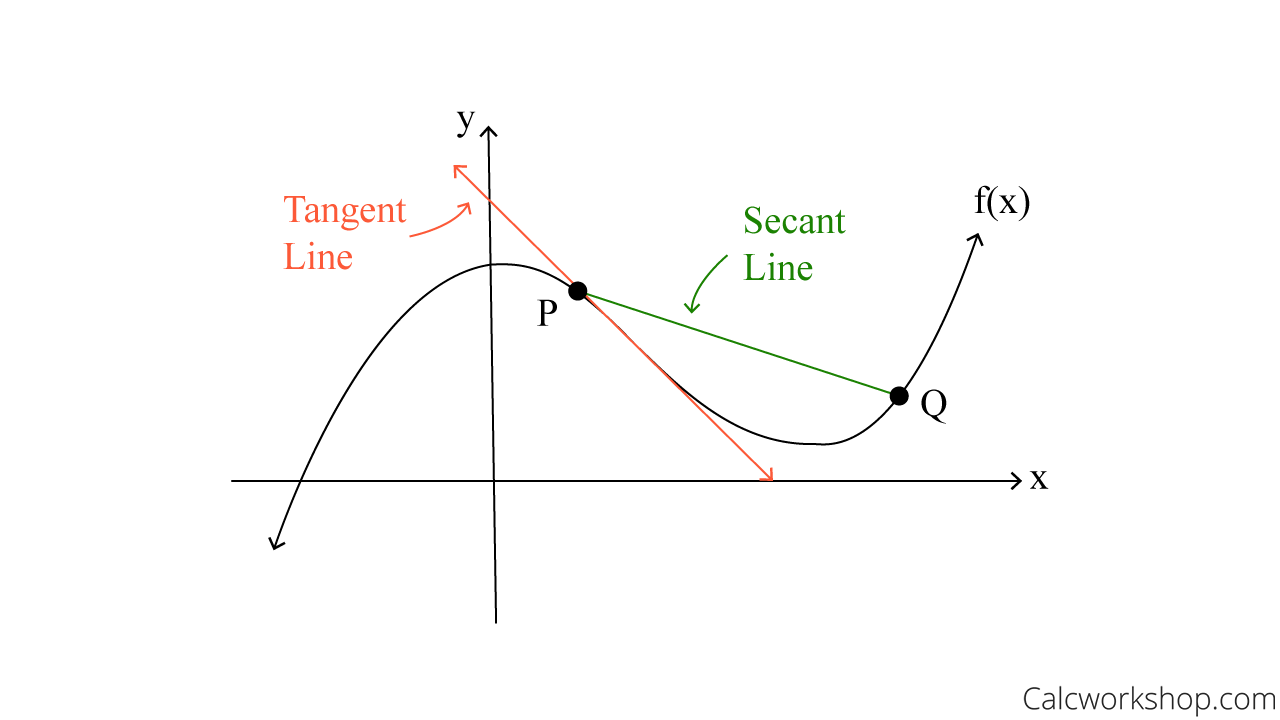
Using the graph above, we can see that the green secant line represents the average rate of change between points P and Q, and the orange tangent line designates the instantaneous rate of change at point P.
Average Rate of Change of a Function Over an Interval
How do you find the average rate of change?
Finding an average rate of change is just finding the slope between 2 points. You can always find the slope. The slope could be 0. It could be a number/0 = undefined. Or, it could be an integer or fraction. Show more Why are we doing the rate of change with these equations instead of how we were taught in the videos?
What is average rate of change?
It is a measure of how much the function changed per unit, on average, over that interval. It is derived from the slope of the straight line connecting the interval’s endpoints on the function’s graph. Want to learn more about average rate of change? Check out this video. We can see from the graph that f ( 0) = − 7 and f ( 9) = 3 .
How do you find the average rate of change over two points?
Calculate the average rate of change over the two points. Use the equation to find the slope of the secant line that intersects the two points. If you wanted to find the instantaneous rate of change for f (x) = x 2 + 4x when x = 2, then you could make your first secant line at the points (1, 5) and (3, 21) The slope of that line is , or 8.
What is the average rate of change of a function?
Learn about the average rate of change. The average rate of change of a function is given as: Where f (b) and f (a) are the values of the function f at points b and a respectively. The formula gives us the rate of increase (or decrease) the function experiences between endpoints a and b.
