The price-to-sales (P/S) ratio is an important valuation metric that compares a company’s market capitalization to its total revenue over the past 12 months. This ratio gives investors an idea of how much they are paying for each dollar of sales generated by the company. A lower P/S ratio is generally considered better, as it suggests the stock may be undervalued. But what exactly is considered a “good” P/S ratio?
As with any financial ratio, there is no one-size-fits-all answer. The appropriate P/S ratio varies significantly across different industries. A high-growth tech company will often have a much higher P/S ratio than a mature industrial manufacturer. The average P/S ratio within each sector provides a useful benchmark for comparison.
According to NYU professor Aswath Damodaran, the current average P/S ratios across sectors are
- Tech: 5.5x
- Healthcare: 4.4x
- Consumerservices: 2.4x
- Consumer goods: 2.2x
- Industrials: 1.6x
- Basic materials: 1.0x
- Utilities: 1.6x
So clearly, a P/S ratio of 5 would be stellar for an industrial company but worrisomely low for a tech company. The key is to compare companies to their direct competitors within the industry.
While industry averages provide a helpful starting point, other factors also impact what P/S ratio is attractive for a given company Here are some considerations
Growth Outlook
High-growth companies warrant higher P/S ratios, because investors are betting on future earnings potential. Young companies pursuing an aggressive growth strategy would be expected to have above-average P/S ratios. Mature companies with steady, predictable growth command lower ratios.
Profit Margins
The P/S ratio only considers revenue and ignores profitability. But a company with fat profit margins will trade at a higher multiple than a company with razor-thin margins, all else being equal Investors will pay more for $1 of sales if that $1 is highly likely to convert into profits.
Capital Structure
The P/S ratio does not account for debt levels. So a company with significant leverage may have a lower P/S ratio than a comparable unlevered peer. The EV/Sales ratio improves upon P/S by incorporating debt and cash into the valuation.
Quality of Revenue
Recurring revenue streams from long-term contracts are valued more highly than one-time transactional revenue. Software-as-a-service (SaaS) companies, for example, command premium P/S ratios due to their subscription-based business models.
Competitive Advantage
Companies with wide economic moats, strong pricing power, and customer loyalty can extract more value from each dollar of sales. The strength and sustainability of a company’s competitive edge factors into its deserved P/S multiple.
Now let’s walk through some examples to get a feel for good P/S ratios:
-
Company A trades at a P/S ratio of 0.8x, while its direct competitor trades at 1.2x. All else equal, Company A appears undervalued and attractive for investment.
-
Company B has posted 20%+ revenue growth annually for the past 5 years. Its P/S ratio of 4x, while above industry average, seems justified by the impressive growth.
-
Company C operates on razor-thin 2% net margins, while competitors average 8%. Its below-average P/S ratio of 1.5x makes sense given the weak profitability.
-
Company D relies heavily on leverage, with a debt/equity ratio of 2.0x. Its P/S ratio of 1.2x likely understates the valuation relative to its all-equity competitors trading at 2.0x sales.
-
Company E enjoys strong pricing power and over 80% recurring revenue. A premium P/S ratio of 3.5x (vs. 2.5x industry average) looks attractive for this high-quality revenue stream.
The bottom line is that the appropriate P/S ratio depends heavily on the company specifics. While a lower ratio is broadly better, high growth potential, strong competitive advantages, and recurring revenue streams may justify higher multiples. The key is not to focus on P/S in isolation, but to consider it as part of a holistic evaluation of a company’s fundamentals and future prospects.
When assessing any potential investment, prudent investors will gather a variety of perspectives. Check the company’s historical P/S range, compare to industry peers, evaluate future outlook, and analyze other financial ratios before passing judgement on the stock as undervalued or overvalued. No single ratio provides the full picture.
The P/S ratio has some limitations worth noting. Firstly, it can be misleading when comparing companies across vastly different industries, since each sector has its own normal range. Secondly, it ignores profit margins, so fails to measure how efficiently sales drive bottom-line profits. And thirdly, it does not account for balance sheet risk, since no leverage or liquidity ratios factor in.
Despite these shortcomings, the P/S ratio remains a quick and useful first-pass metric to include in your toolkit when screening for potentially underpriced stocks. Combined with other ratios like P/E and P/B as well as due diligence on the qualitative aspects of the business, the P/S ratio can help identify good investment opportunities trading below their fair value.
So while there are industry-specific guidelines, the real answer to what’s a “good” P/S ratio depends on the company’s individual growth outlook, competitive position, balance sheet, and future prospects. Use the P/S ratio as one helpful input, not the sole deciding factor, when constructing your investment thesis. A stellar business with improving margins and defensible competitive advantages may deserve a seemingly high P/S ratio. Likewise, a struggling business in secular decline may warrant a P/S well below its industry peers. As with most investing questions, “it depends” is the truth!
Example of Calculation Let’s delve into a practical example to elucidate the application of the P/S ratio. Imagine there’s a Company This hypothetical entity boasts a market capitalization of $50 million. In the last fiscal year, they reported total sales amounting to $10 million. Plugging these numbers into our formula, the calculation becomes:

What is a good price to sales ratio? A good price-to-sales ratio can be subjective and often contingent upon the industry in question. Different sectors have different operational dynamics, margins, and growth prospects, which invariably influence what constitutes a “good” ratio. Typically, a lower ratio is indicative of a stock potentially being undervalued. It suggests that the company’s shares are trading at a lesser value compared to its sales, which might spell a lucrative buying opportunity for eagle-eyed investors. On the flip side, a higher ratio could be a red flag, hinting at the stock being overpriced. It’s crucial, however, to juxtapose this ratio against industry peers for a more holistic understanding. Blindly relying on the metric without a broader industry context can be misleading.
Price to Sales Ratio Explained | Finance in 5 Minutes!
What is price to sales ratio (P/S)?
In short, the price to sales ratio (P/S) reflects the value that the market places on the sales of a specific company, which is determined by its revenue quality (i.e. customer type, recurring vs. one-time), as well as expected performance.
What is a price-to-sales ratio?
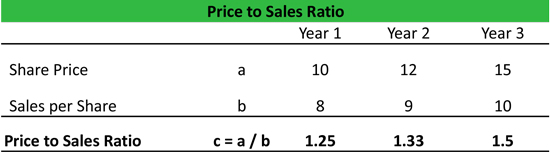
Price-to-Sales Ratio = Market Value per Share / Sales per Share The P/S ratio is considered a particularly good metric for evaluating companies in cyclical industries that may not show an actual net profit every year. Because the P/S ratio considers a company’s past 12 months of revenue, it absolves any cyclicality or seasonality.
What is a price to sales ratio?
Among the plethora of valuation metrics available, the price to sales ratio stands out for its simplicity and clarity. This ratio serves as a barometer, gauging a company’s market value vis-à-vis its revenue. As we navigate the complexities of stock evaluations, understanding the nuances of the price to sales ratio becomes indispensable.
How do you calculate price-to-sales ratio?
The metric can be calculated based on aggregate totals or on a per-share basis: Price-to-Sales Ratio = Total Company Market Capitalization / Total Company Sales Price-to-Sales Ratio = Market Value per Share / Sales per Share
