Elasticity of demand is a fundamental concept in economics that measures how sensitive the quantity demanded of a good or service is to changes in its price. Specifically, the formula for elasticity of demand quantifies the relationship between percentage changes in price and quantity demanded. Understanding elasticity is crucial for businesses and policymakers when making pricing and regulatory decisions. This article will explain the formula for calculating elasticity and discuss factors that determine whether demand is elastic, inelastic or unitary.
What is Elasticity of Demand?
Elasticity of demand refers to how responsive the quantity demanded is to changes in price. If a small change in price leads to a big change in quantity demanded, demand is said to be elastic. Conversely, if changes in price only lead to minor changes in quantity demanded, demand is inelastic.
Economists use the formula for elasticity of demand to quantify this relationship between price and quantity The formula expresses elasticity as the ratio of the percentage change in quantity demanded to the percentage change in price This measures the sensitivity of consumers to changes in the good’s price,
Formula for Calculating Elasticity of Demand
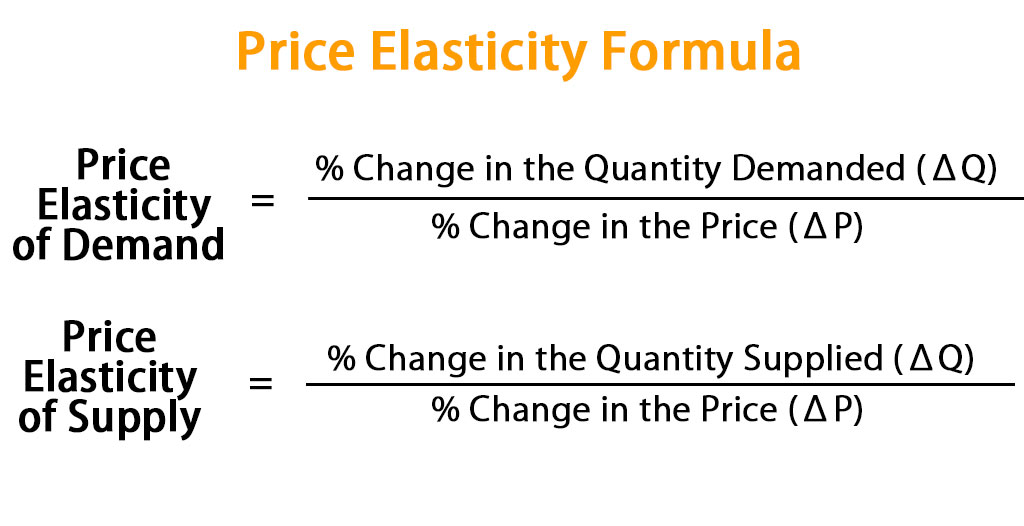
The formula for calculating elasticity of demand is:
Elasticity of Demand = Percentage Change in Quantity Demanded / Percentage Change in PriceTo calculate this:
- Percentage change in quantity demanded is calculated as: (New Quantity – Old Quantity)/Old Quantity
- Percentage change in price is: (New Price – Old Price)/Old Price
Example:
- Old Price: $2
- New Price: $2.50
- Old Quantity: 100 units
- New Quantity: 90 units
Percentage change in price = ($2.50 – $2)/$2 = 25%
Percentage change in quantity = (90 – 100)/100 = -10%
Elasticity of Demand = -10%/25% = -0.4
Since elasticity is a ratio of percentages, it is unit-less. Also, since quantity and price move in opposite directions, elasticities are negative but the absolute value is used when interpreting them.
Elastic, Inelastic, and Unitary Demand
Based on the elasticity formula, demand can be classified into three types:
-
Elastic demand: Elasticity > 1. A 1% change in price causes more than a 1% change in quantity demanded. Consumers are very responsive to price changes.
-
Inelastic demand: Elasticity < 1. A 1% price change causes less than a 1% change in quantity demanded. Consumers are not highly sensitive to price changes.
-
Unitary elastic demand: Elasticity = 1. A 1% price change leads to a 1% change in quantity demanded.
Understanding whether demand is elastic, inelastic, or unitary for a product helps businesses set optimal pricing strategies.
What Determines Elasticity of Demand?
Several factors impact the elasticity of demand for a good or service:
-
Availability of substitutes: More substitutes make demand more elastic, as consumers can easily switch between similar products if one gets too expensive.
-
Necessity: Demand is inelastic for necessities like basic foods and medicine. Luxuries tend to have more elastic demand.
-
Proportion of income: Goods taking up a large proportion of income have more elastic demand.
-
Time: Demand is more inelastic in the short run but grows more elastic over time as consumers find alternatives.
Examples of Elastic and Inelastic Demand
-
Elastic demand: Air travel, restaurant meals, furniture, new cars. Consumers can reduce spending on these discretionary items if prices increase.
-
Inelastic demand: Staple foods like milk and eggs, gasoline, electricity, prescription drugs. Being necessities, consumption remains steady despite price hikes.
-
Unitary elastic: Products like lipstick, wine, and cigarettes tend to have demand that is neither highly elastic nor inelastic, with elasticities close to 1.
Importance of Elasticity of Demand
Understanding elasticities helps businesses make better pricing and marketing decisions. It also assists policymakers in setting taxes and regulations. Some examples:
-
Businesses can raise prices more easily for goods with inelastic demand without losing many sales.
-
Governments can increase tax revenue by taxing inelastic goods like cigarettes because consumption won’t drop much.
-
Policymakers can better predict how regulations like rent control will impact housing markets using elasticity estimates.
-
Marketing for discretionary items works best if aimed at more elastic market segments.
While the formula for elasticity of demand is simple in theory, accurately estimating elasticities in practice can be challenging. However, grasping the basic concept and factors that determine elastic vs. inelastic demand provides business professionals and policy analysts with a useful analytical framework for decision-making.
Related to this video
In our first lecture on the elasticity of demand, we explain the intuitive meaning of elasticity. It measures the responsiveness of the quantity demanded to a change in price. More responsive means more elastic. In this lecture, were going to show how to create a numeric measure of elasticity. How to calculate with some data on prices and quantities, what the elasticity is over a range of the demand curve.
So heres a more precise definition of elasticity. The elasticity of demand is the percentage change in quantity demanded divided by the percentage change in price. So lets write it like this. We have some notation here. The elasticity of demand is equal to the percentage “change in”. Delta is the symbol for change in, so this is the percentage change in the quantity demanded divided by the percentage change in the price. Thats the elasticity of demand. Lets give an example or two.
So, if the price of oil increases by 10% and over a period of several years the quantity demanded falls by 5%, then the long run elasticity of demand for oil is what? Well, elasticity is the percentage change and the quantity demanded. Thats -5% divided by the percentage change in the price. Thats 10%. So the elasticity of demand is -5% divided by 10%, or -0.5. Elasticities of demand are always negative because when price goes up, the quantity demanded goes down. When price goes down, the quantity demanded goes up. So we often drop the negative sign and write that the elasticity of demand is 0.5.
Heres some more important notation. If the absolute value of the elasticity of demand is less than one, just like the example we just gave for oil, we say that the demand curve is inelastic. Elasticity of demand less than one, the demand curve is inelastic. If the elasticity of demand is greater than one, we say the demand curve is elastic. And if elasticity of demand is equal to one, that is the knife point case, then the demand curve is unit elastic. These terms are going to come back, so just keep them in mind. Inelastic: less than one. Elastic: greater than one.
So we know that elasticity is the percentage change in quantity divided by the percentage change in price, how do we calculate the percentage change in something? This is not so hard, but it could be a little bit tricky for the following reason. Lets suppose youre driving down the highway at 100 miles per hour. I dont recommend this, but lets just imagine that you are. Youre going 100 miles per hour, and now you increase speed by 50%. How fast are you going? 150 miles per hour, right? Okay, so now youre going 150 miles per hour. Suppose you decrease speed by 50%. Now, how fast are you going? 75 miles per hour, right?
So how is it that you can increase speed by 50% and then decrease by 50% and not be back to where you started? Well the answer is, is that intuitively, we have changed the base by which we are calculating the percentage change. And we dont want to have this inconsistency when we calculate elasticity. We want people to get the same elasticity whether theyre calculating from the lower base or from the higher base. So, because of that, were going to use the Midpoint Formula. So, the elasticity of demand, percentage change in quantity divided by the percentage change in price, thats the change in quantity divided by the average quantity times 100. That will give us the percentage change divided by the change in price divided by the average price. Again, that times 100. Notice, since weve actually got 100 on top and 100 on the bottom, those 100s we can actually cancel out.
Lets expand this just a little bit more. The change in quantity. What is the change in quantity? Well, lets suppose we have two quantities. Lets call them after and before. It doesnt matter which one we call after or which one before. So, were going to then expand this to the change in quantity. Thats Q after minus Q before divided by the average, Q after plus Q before, divided by two, divided by the change in price, P after minus P before, divided by the average price, b after plus b before, divide by two. So thats a little bit of a mouthful, but everything, I think, is fairly simple. Just remember change in quantity divided by the average quantity and you should always be able to calculate this. Lets give an example.
Okay, heres an example of a type of problem you might see on a quiz or a mid term. At the initial price of $10, the quantity demanded is 100. When the price rises to $20, the quantity demanded falls to 90. What is the elasticity is, what is the elasticity over this range of the demand curve? Well, we always want to begin by writing down what we know — our formula. The elasticity of demand is the percentage change in quantity divided by the percentage change in price. Now, lets remember to just expand that. Thats Delta Q over the average Q all divided by Delta P over the average P.
Now, we just start to fill things in.
So our quantity after, okay, after the change is 90. Our quantity before that was 100. So on the top, the percentage change in quantity is 90 minus 100 divided by 90 plus 100, over two. That is the average quantity. And then on the bottom, and the only trick here is always write it in the same order, so if you put the 90 here, then make sure you put the 20, the number the price which is associated with that quantity started off the same way. So, always just keep it in the same order. So on the bottom, then, we have the quantity — the price after — which is 20 minus the price before, which is 10, divided by the average price.
And now, just, its numerics. You plug in the numbers and what you get is the elasticity of demand is equal to -0.158, approximately. We can always drop the negative sign because these things, elasticity of demands, are always negative. So its equal to 0.158. So does this make the elasticity of demand over this range elastic or inelastic? Inelastic, right? The elasticity of demand weve just calculated is less than one, so that makes this one inelastic. There you go.
We need to cover one more important point about the elasticity of demand, and that is its relationship to total revenue. So a firms revenues are very simply equal to price times quantity sold. Revenue is equal to price times quantity. Now, elasticity, its all about the relationship between price and quantity, and so its also going to have implications for revenue. Lets give some intuition for the relationship between the elasticity and total revenue. So revenue is price times quantity. Now suppose the price goes up by a lot and then quantity demanded goes down, just by a little bit. What then is going to be the response of revenue? Well, if price is going up by a lot and quantity is going down just by a little bit, then revenue is also going to be going up. Now, what kind of demand curve do we call that, when price goes up by a lot and quantity falls by just a little bit? We call that an inelastic demand curve. So, what this little thought experiment tells us is that when you have an inelastic demand curve, when price goes up revenue is also going to go up, and of course, vice versa.
Lets take a look at this with a graph. So heres our initial demand curve, a very inelastic demand curve, at a price of $10, the quantity demanded is 100 units, so revenue is 1,000. Notice that we can show revenue in the graph by price times quantity. Now, just looking at the graph, look at what happens when the price goes up to 20. Well, the quantity demanded goes down by just a little bit, in this case to 90, but revenues go up to 1,800. So you can just see, by sketching the little graph, what happens to revenues when price goes up when you have an inelastic demand curve. And again, vice versa. Lets take a look about what happens when you have an elastic demand curve.
So lets do the same kind of little thought experiment, revenue is price times quantity. Suppose price goes up by a modest amount and quantity goes down by a lot. Well, if price is going up by a little bit and quantity is going down by a lot, then revenue must also be falling. And what type of demand curve is it when price goes up by a little bit, quantity falls by a lot? What type of demand curve is that? Thats an elastic demand curve. So, revenues fall as price rises with an elastic demand curve. And again, lets show that. If youre ever confused and you cant quite remember, just draw the graph. I can never remember, myself, but I always draw these little graphs. So, draw a really flatter, elastic demand curve. In this case, at a price of $10, the quantity demanded is 250 units. So revenues is 2,500. And see what happens, when price goes up, price goes up to $20, quantity demanded falls to 50, so revenue falls to 1,000. And again, you can just compare the sizes of these revenue rectangles to see which way the relationship goes. And of course, this also implies, going from $20, the price of $20 to a price of $10, revenues increase. So with an elastic demand curve, when price goes down, revenues go up.
So heres a summary of these relationships. When the elasticity of demand is less than one, thats an inelastic demand curve and price and revenue move together. When one goes up, the other goes up. When one goes down, the other goes down. If the elasticity of demand is greater than one, thats an elastic demand curve and price and revenue move in opposite directions. And could you guess what happens if the elasticity of demand is equal to one — if you have a unit elastic curve? Well then, when the price changes, revenue stays the same. Now, if you have to, again, memorize these, but its really much better to just sketch some graphs. I never remember them, as Ive said myself, I never remember these relationships, but I can always sketch an inelastic graph and then with a few changes in price, I can see whether the revenue rectangles are getting bigger or smaller and so Ill be able to recompute all of these relationships pretty easily.
Heres a quick practice question. The elasticity of demand for eggs has been estimated to be 0.1. If egg producers raise their prices by 10%, what will happen to their total revenues? Increase? Decrease? Or it wont change? Okay, how should we approach this problem? If the elasticity of demand is 0.1, what type of demand curve? Inelastic demand. Now, whats the relationship between an inelastic demand curve? When price goes up, what happens to revenue? If youre not sure, if you dont remember, draw some graphs. Draw an inelastic, draw an elastic, figure it out. Okay, lets see. What happens? Revenue increases, right? If you have an inelastic demand curve and price goes up, revenue goes up as well.
Heres an application. Why is the war on drugs so hard to win? Well, drugs are typically going to have a fairly inelastic demand curve. What that means is that when enforcement actions raise the price of drugs, make it more costly to get drugs, raising the price, that means the total revenue for the drug dealers goes up. So check out this graph. Here is the price with no prohibition, heres our demand curve, our inelastic demand curve. What prohibition does, is it raises the cost of supplying the good. But that raises the price, which is what its supposed to do, and that does reduce the quantity demanded of the drug. But it also has the effect of increasing seller revenues. And seller revenues may be where many of the problems of drug prohibition come from. Its the seller revenues which drive the violence, which drive the guns, which make it look good to be a drug dealer, which encourage people to become drug dealers, and so forth. So theres a real difficulty with prohibition, with prohibiting a good, especially when it has an inelastic demand.
Heres another application of elasticity of demand and how it can be used to understand our world. This is a quotation from 2012 from NPRs food blog “The Salt.” “Youve all heard a lot about this years devastating drought in the Midwest, right? US Department of Agriculture announced last Friday that the average US cornfield this year will yield less per acre than it has since 1995. Soybean yields are down, too. So you think that farmers who grow these crops must be really hurting. And thats certainly the impression you get from media reports. But hows this, for a surprising fact? On average, corn growers actually will rake in a record amount of cash from their harvest this year.” So can you explain this secret side of the drought? Im not going to answer this question. This is exactly the type of question you might receive on an exam. But you should be able to answer it by now, with a few sketches on a piece of paper. And in particular, what I want you to answer is, what type of demand curve, for corn, would make exactly this type of outcome perfectly understandable? Not a secret or surprise, but perfectly understandable.
Okay, thats the elasticity of demand. Next time well be taking up the elasticity of supply, and well be able to move through that material much quicker because it covers many similar concepts. Thanks.
- English
- Spanish
- Chinese
- Hindi
- French
- Arabic
Thanks to our awesome community of subtitle contributors, individual videos in this course might have additional languages. More info below on how to see which languages are available (and how to contribute more!).
Calculating the Elasticity of Demand
Elasticity of demand is equal to the percentage change of quantity demanded divided by percentage change in price. In this video, we go over specific terminology and notation, including how to use the midpoint formula. We apply elasticity of demand to the war on drugs, and more broadly to the prohibition of a good when it has an elastic demand.
Calculating Elasticity of Demand [GIVEN A CHANGE IN PRICE] | Think Econ
How do you calculate price elasticity of demand?
The formula of Price elasticity of demand is the measure of elasticity of demand based on price, which is calculated by dividing the percentage change in quantity (∆Q/Q) by percentage change in price (∆P/P) which is represented mathematically as Price Elasticity of Demand = Percentage Change in Quantity (∆q/q) / Percentage Change in Price (∆p/p)
What is price elasticity of demand?
Learn about the price elasticity of demand, a concept measuring how sensitive quantity is to price changes. Elasticity is calculated as percent change in quantity divided by percent change in price. Elastic situations have elasticity greater than 1, while inelastic situations have elasticity less than 1.
What is the elasticity of a demand curve?
This is a price increase of 60% and a quantity decline of 20%, an elasticity of for that part of the demand curve. If the price falls from $16 to $10 and the quantity rises from 80 units to 100, however, the price decline is 37.5% and the quantity gain is 25%, an elasticity of for the same part of the curve.
How do you calculate price elasticity of demand for CDs?
To calculate a percentage, we divide the change in quantity by initial quantity. If price rises from $50 to $70. We divide 20/50 = 0.4 = 40% When the price of CD increased from $20 to $22, the quantity of CDs demanded decreased from 100 to 87. What is the price elasticity of demand for CDs? Calculating a Percentage
