What: This article highlights the importance of significance level, confidence level, and confidence interval in drawing conclusions and making informed decisions while working with data.
Why: This article aims to help readers understand the differences and connections between these concepts and how they can be used to make informed decisions while working with data.
If you are working with data, it is crucial to consider the data’s quality, precision, and reliability. The significance level, confidence level, and confidence interval are fundamental concepts that play a vital role in drawing conclusions and making informed decisions. While using sample data in statistics, hypothesis testing is essential. Drawing inferences from sample data may not always represent the whole population. There are basically two types of hypotheses and errors during data interpretation:
The null hypothesis states no relationship between the variables, whereas the alternative hypothesis states a significant relationship between the variables in a data set. There are two types of errors associated with hypothesis testing. The two types of errors are related to drawing an incorrect conclusion. Type I error, generally known as false positives, rejects a null hypothesis that is true. On the other hand, Type II error, generally known as false negative, fails to reject a null hypothesis that is false. In this article, we will look at the differences between significance level, confidence level, and confidence interval. And how these concepts help in improving the accuracy of the data and the results.
In general terms, the level of significance (significance level, or alpha) measures the evidence present in your sample so that you can accurately reject the null hypothesis. A null hypothesis occurs when both possibilities or outcomes are the same. A significance level is used to determine if the null hypothesis is true or not. If the significance level is low, it may indicate a lack of evidence for rejecting the null hypothesis.
The confidence level, on the other hand, indicates the probability of obtaining the same results if you repeat the same data collection processes like tests, polls, or surveys. The confidence level is established before conducting the data integration and collection, typically between 90% and 99%. It helps you determine whether the results from sample data apply to the entire population.
The confidence interval is a range of results that summarizes a data set or sample through statistical evidence like the mean, median, and standard deviation. Both confidence level and significance level are used to determine the confidence interval; however, the confidence level is taken into consideration to calculate the interval.
As a statistics student or data analyst, you’ve likely encountered the terms “confidence level” and “confidence interval” before. While they sound very similar, these two concepts are actually quite distinct Understanding the differences between confidence levels and confidence intervals is critical for interpreting and reporting statistical findings accurately
In this article, I’ll explain in clear terms what confidence levels and confidence intervals represent how they are calculated and when you would use each one. I’ll also provide plenty of examples to help cement your comprehension of these fundamental statistical ideas. Let’s get started!
What is a Confidence Level?
A confidence level expresses how sure you can be that the results from a sample accurately reflect the real characteristics of the overall population. It is represented by a percentage – typically 90%, 95% or 99%.
For example, suppose a survey of 500 voters showed that 60% prefer Candidate A. If the pollster reports this finding with a 95% confidence level, they are essentially saying:
“If we surveyed different random samples of 500 voters again and again, 95% of those samples would show Candidate A’s support between some range of values.”
This range of values is called the confidence interval, which we’ll explore next. The key point for now is that the confidence level tells you how certain you can be that the population parameter (like candidate support) lies within the interval.
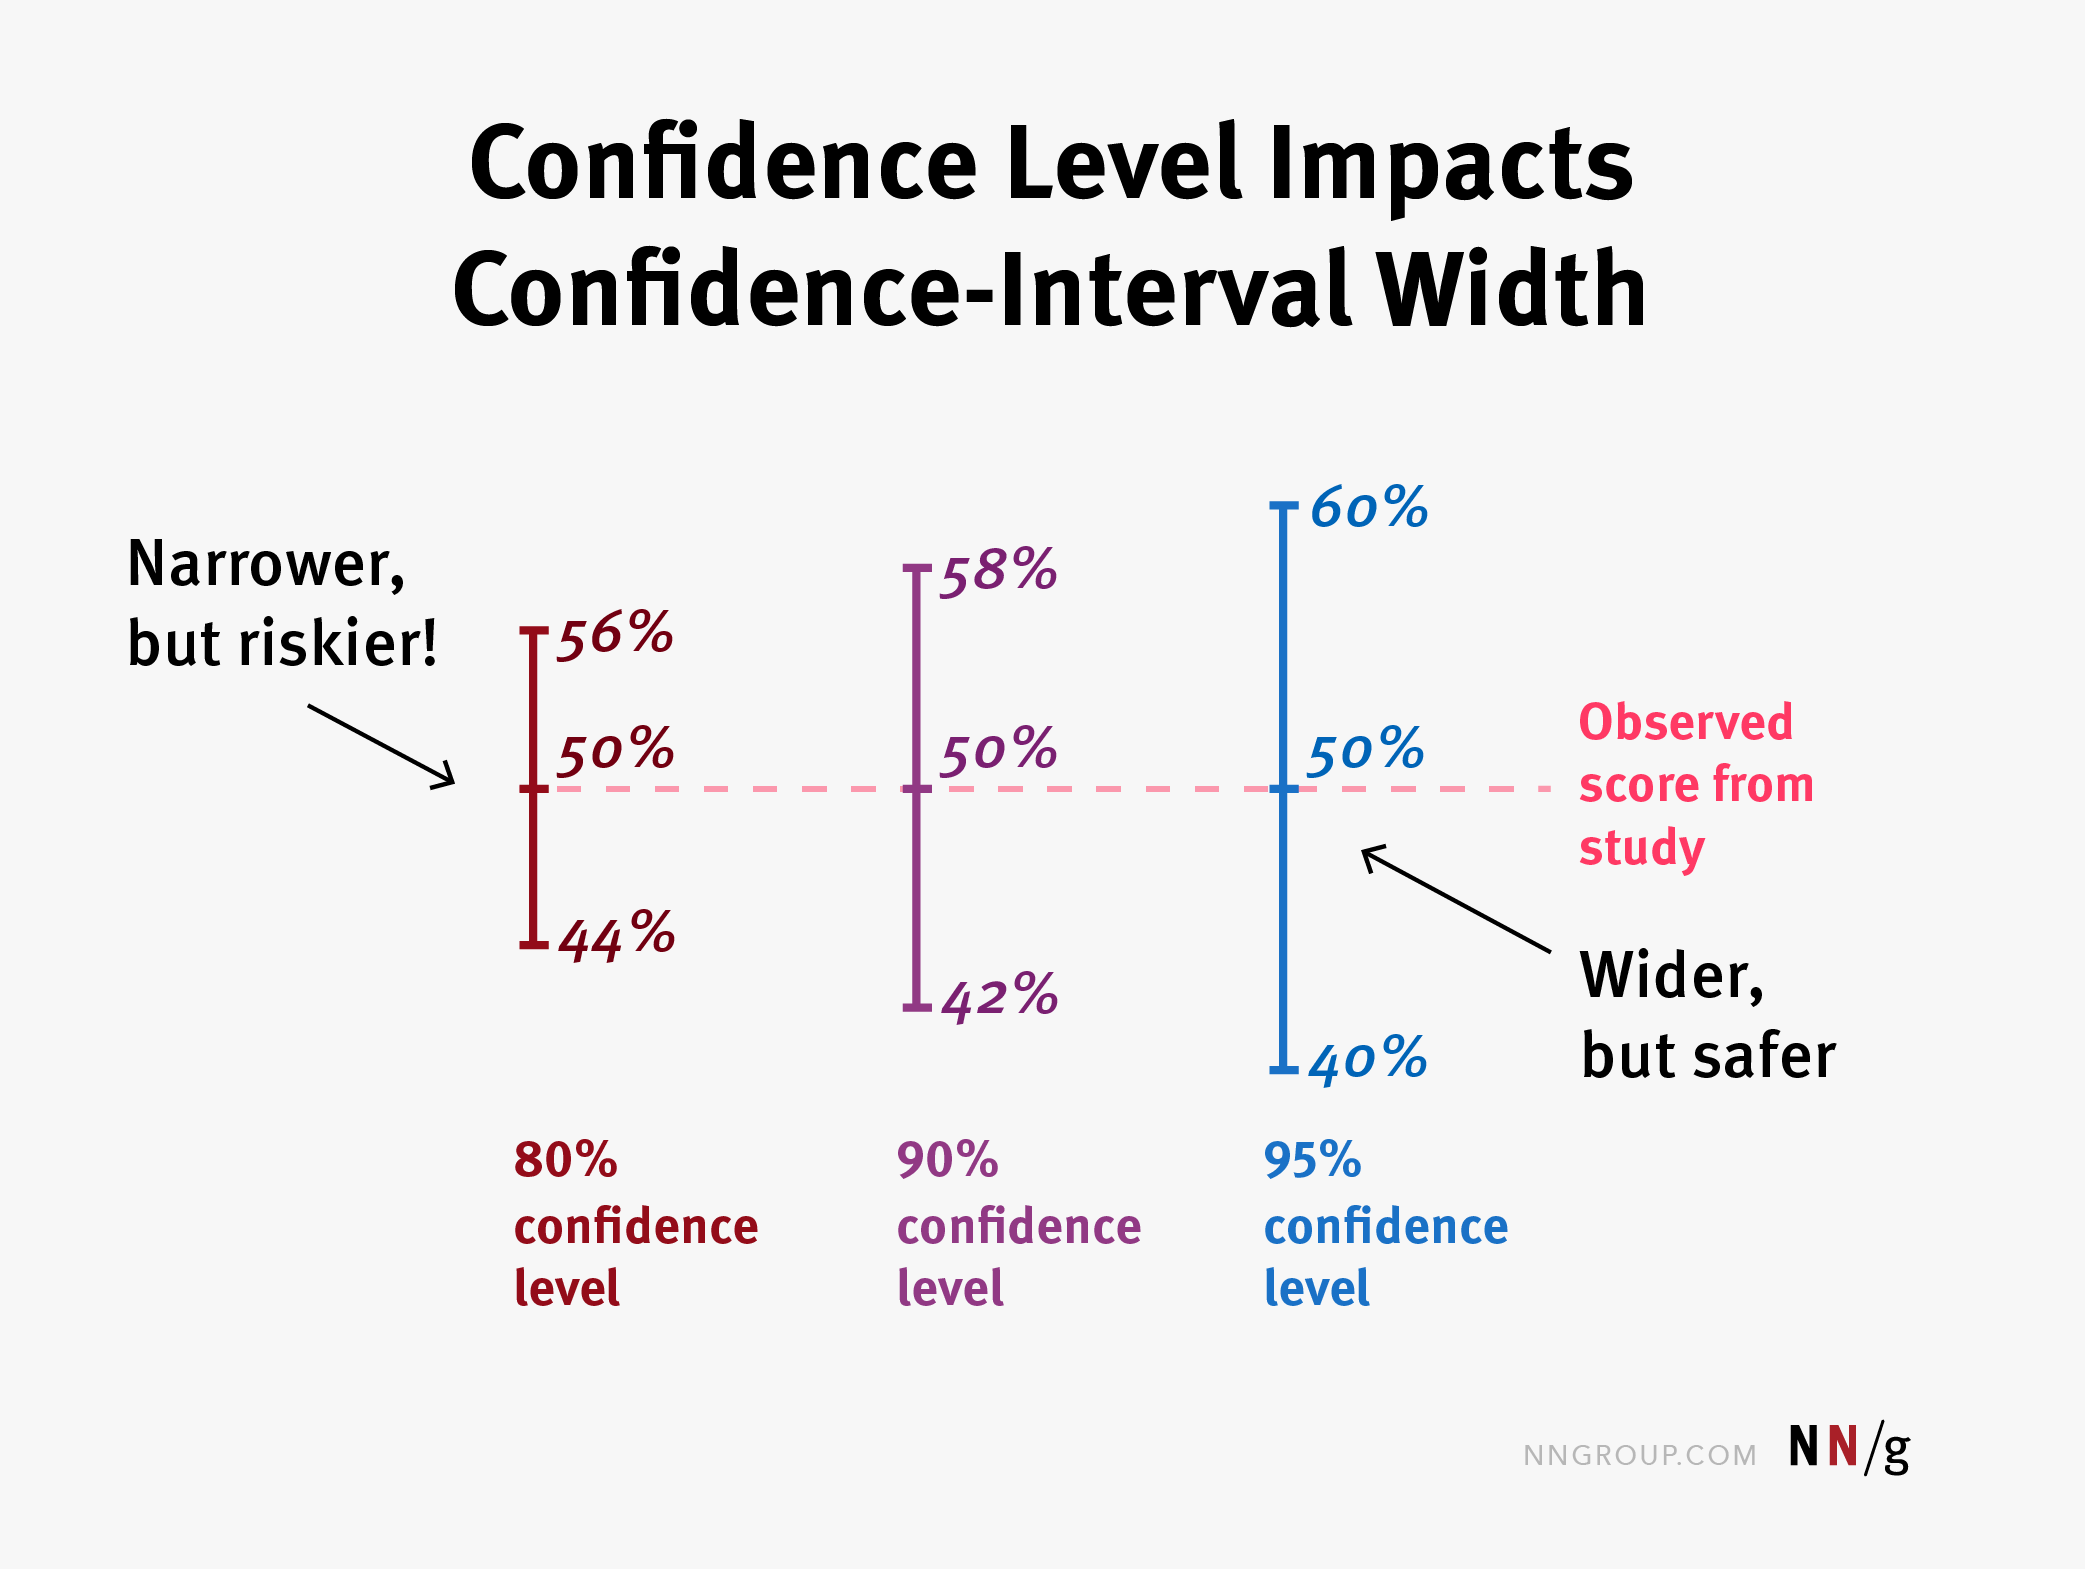
Higher confidence levels indicate narrower intervals but require larger sample sizes. Lower confidence levels have wider intervals but need fewer respondents. Selecting an appropriate confidence level depends on factors like:
- How precise you need the estimate to be
- Time and resources available for sampling
- Acceptable margin of error
Common confidence level choices are 90% (less rigorous), 95% (standard), and 99% (most rigorous/precise).
What is a Confidence Interval?
While a confidence level states how sure you are, a confidence interval gives the specific range of plausible values for the population parameter based on the sample.
Let’s say a survey reported Candidate A’s support as 50% ± 3% with a 95% confidence level. This means:
- 50% is the sample percentage who support Candidate A
- ± 3% is the margin of error
- The 95% confidence level indicates 95% of survey samples would produce a percentage for Candidate A between 47% and 53% (the confidence interval)
This range of 47% to 53% is expected to contain the true population parameter. Calculating a confidence interval allows you to quantify the uncertainty in your estimate.
Wider intervals indicate more uncertainty. The width expands or contracts based on factors like:
- Confidence level – Higher confidence means wider interval
- Sample size – Larger samples produce narrower intervals
- Variability in data – More spread leads to wider intervals
How to Calculate a Confidence Interval
While there are some variations for different statistics, the basic formula for a confidence interval is:
(Point estimate) ± (Critical value) x (Standard error)
Common point estimates include the sample mean, proportion, difference between means, etc. The critical value depends on the confidence level – higher confidence uses a larger critical value. The standard error measures the variability in the sample data.
Let’s walk through an example:
- Sample mean (point estimate) = 50
- Standard error = 5
- 95% confidence level (Critical value = 1.96)
- Calculation:
- CI = Point estimate ± Critical value x Standard error
- CI = 50 ± 1.96 x 5
- CI = 50 ± 9.8
- Confidence Interval = (40.2, 59.8)
This 95% confidence interval of (40.2, 59.8) suggests we can be 95% confident the true population mean lies between 40.2 and 59.8 based on our sample.
When to Report Confidence Level vs. Interval
Because confidence levels and intervals are so closely related, it’s important to know when to report each one.
Use a confidence interval when you want to provide the specific range of likely values for a population parameter based on a sample. The interval quantifies the uncertainty around your estimate.
Report the confidence level when you want to state precisely how sure you can be that the population parameter lies within that range. It conveys the rigor and statistical power of your sample.
For a complete picture, reputable studies will report both the confidence interval and associated confidence level, as the examples below demonstrate:
- “Approval for the new policy was 60% +/- 5% with a 95% confidence level”
- “The study found life expectancy was 75 +/- 2 years at a 90% confidence level”
- “The population mean is estimated to be 25,000 +/- 1,500 (99% confidence interval)”
Reporting both statistics helps audiences interpret your findings appropriately.
Confidence Level vs. Statistical Significance
One common misconception is thinking a higher confidence level implies statistical significance of the results. However, they are completely separate concepts:
- Confidence level = how sure you are the population parameter is within a certain range
- Statistical significance = whether a test statistic indicates a real effect in the population or if it could have arisen by chance
Results can have a high confidence level (like 99%) but still lack statistical significance. Or data may be statistically significant without a high confidence level. Do not equate these two terms.
Putting Confidence Levels and Intervals Into Practice
Now that you understand the differences between confidence levels and confidence intervals, let’s review some key points to help apply these concepts:
- The confidence level conveys how sure you can be your interval contains the population parameter
- Higher confidence levels require larger sample sizes
- The confidence interval quantifies the range of plausible values based on sample data
- Wider intervals indicate more uncertainty around the estimate
- For complete reporting, include both the confidence level and interval
- Confidence level ≠ statistical significance
With this knowledge, you are now prepared to properly interpret, calculate and report confidence levels and intervals in your own statistical work. These are foundational concepts for drawing sound conclusions from data – so be sure you have a solid grasp to succeed and communicate your findings effectively.
Frequently Asked Questions About Confidence Levels and Intervals
Here are answers to some common questions about these two key statistical concepts:
What happens if I increase the confidence level?
A higher confidence level widens the confidence interval, indicating more certainty but less precision. For example, going from a 90% to 95% confidence level expands the range of plausible values for the population parameter.
Can I have a 100% confidence level?
No, 100% confidence is impossible in statistics since we can never be completely certain that a sample fully represents the population. Confidence levels below 100% quantify that uncertainty.
What does a wide confidence interval mean?
A wider interval means more uncertainty around the estimate. This could be from a lower confidence level, smaller sample size, or highly variable data.
If intervals overlap, does that mean the differences are not significant?
No, overlapping confidence intervals alone do not indicate a lack of statistical significance between results. Significant differences are determined by additional hypothesis testing.
Can I calculate a confidence interval for any statistic?
Yes, you can construct confidence intervals for many statistics like means, proportions, differences in means, regression coefficients, etc. The formula varies slightly for each one.
Conclusion
Understanding confidence levels versus confidence intervals is key to conducting and assessing statistical analyses properly. While these terms sound alike, they convey distinct information:
- Confidence level – how sure you are that the interval contains the population parameter
- Confidence interval – the specific plausible range of values based on the sample data
Always report both the confidence level and interval for complete results. Feel free to refer back to this overview as a reference until these concepts are second nature in your statistics journey!
Significance Level vs. Confidence Level
The significance level is the probability of a Type I error, i.e., rejecting a null hypothesis that is true. On the other hand, the confidence level indicates the probability of drawing accurate conclusions based on sample data. The significance level is a concept that deals with testing a hypothesis and avoiding a type I error, while the confidence level deals more with the precision of the results despite the repetition of the test. These two concepts have an inverse relationship, meaning that if the significance level increases, the confidence level decreases, and vice versa. If you want to be more certain of the conclusions you draw, your confidence level needs to be higher.
Confidence level = 1-Significance level
Key Differences and Comparisons
The fundamentals of these concepts in statistics have been examined. These ideas are all closely related to one another and are often used in data analysis and interpretation. An overview of the major differences between these concepts is given here.
