The BCG matrix, developed by the Boston Consulting Group in the 1970s, is a strategic tool used to analyze and manage a company’s product portfolio based on growth rates and market shares. The BCG matrix helps companies evaluate each product line and decide where to allocate resources.
Follow these steps to effectively use the BCG matrix:
1. Choose the Product or Business Unit to Analyze
The first step is to determine what you want to analyze using the BCG matrix Typical options include
- Product lines or brands
- Business units or departments
- Revenue streams
- Customer segments
Choose products or units with interconnected resources and markets but independent products and brands. Avoid assessing the entire company.
2. Define the Relevant Market or Industry
Once you’ve selected the products, define the specific market or industry you’ll use to measure relative market share.
For example. a shampoo brand may analyze
- The overall shampoo market
- Salon shampoo market
- Dandruff shampoo market
Defining the market narrowly gives a more meaningful market share.
3. Calculate the Relative Market Share
The BCG matrix measures market share compared to the largest competitor.
To determine relative market share:
- Identify the market share percentage for each product (unit sales divided by total market sales)
- Identify the competitor with the largest market share
- Compare each product’s market share to the largest competitor’s market share
This relative market share forms the x-axis of the BCG matrix.
4. Determine Market Growth Rates
The y-axis of the BCG matrix measures market growth rates. Determine the recent 1-5 year growth rate for each product’s defined market.
Data sources for growth rates include:
- Industry research reports
- Public financial disclosures
- Sales data
- Customer surveys
Use historical data rather than forecasts when possible.
5. Plot Circles on the BCG Matrix
With the relative market shares and growth rates, you can plot each product on the matrix:
- x-axis is relative market share
- y-axis is market growth rate
The market leader gets plotted farthest right. Rapid growth markets are highest on the vertical axis.
Circle size represents revenue contribution. Bigger circles are higher revenue generators.
6. Analyze the Quadrants
The BCG matrix has 4 quadrants based on high vs low market share and high vs low growth:
Stars
- High growth, high share
- Need heavy investment to maintain dominance
- Manage carefully to maximize cash flow
Cash Cows
- Low growth, high share
- Generate surplus cash that can be invested in other areas
- Manage for continued profits with minimal investment
Question Marks
- High growth, low share
- Potential future stars if market share increases
- Require substantial investment to grow share in competitive market
- Consider divesting question marks that don’t gain share
Dogs
- Low growth, low share
- Unlikely to gain share against dominant rival
- Limit investment, minimize losses
- Phase out dogs when more profitable options exist
7. Make Strategic Investment Decisions
The BCG matrix helps inform resource allocation decisions:
- Invest in stars to drive growth through increased market dominance
- Milk cash cows to fund growth in other areas
- Assess question marks for viability and invest selectively
- Limit further resource commitments to dogs
-Aim to transition dogs to cash cows or divest
Use the matrix to guide investments across the product portfolio.
8. Rethink Market Definitions Periodically
Markets evolve over time. Reassess your market definitions every few years to ensure the BCG matrix reflects the current competitive landscape.
For example, changing demographics or new substitute products may require redefining the market. This affects relative market share and growth rates.
9. Review and Adjust Annually
Run a new BCG matrix analysis annually using updated market share, growth rates and revenue numbers.
Review year-over-year changes:
- Which products are gaining/losing market share?
- What market growth rates are accelerating or declining?
- Which products are moving between quadrants?
Adjust resource allocation according to the latest analysis.
10. Leverage the BCG Matrix for Marketing and Strategy
Beyond resource allocation, the BCG matrix offers other strategic uses:
- Identify priorities for marketing, promotion and product development
- Assess opportunities across business units
- Evaluate acquisition targets or new product launches based on category
- Consider impacts of discontinuing product lines
- Communicate business unit strategies visually
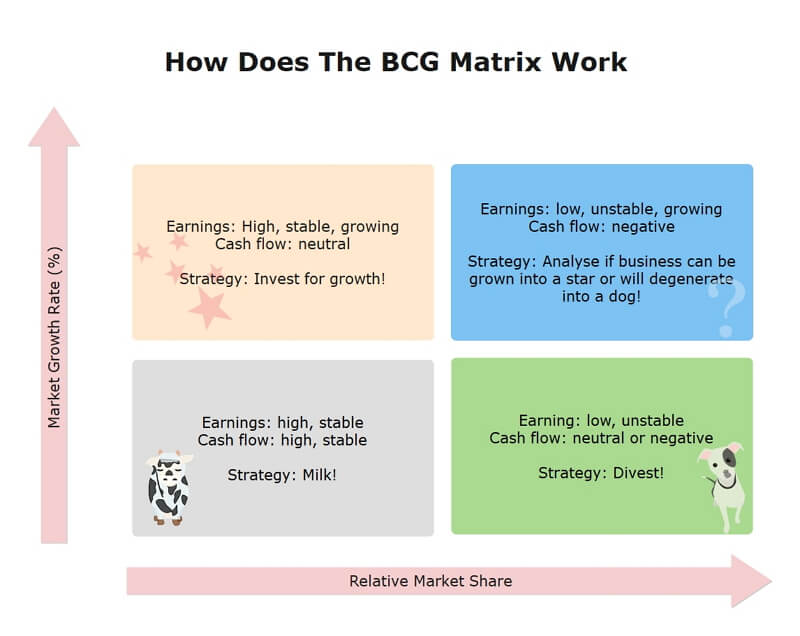
BCG Matrix Example
Below is an example BCG matrix for a company’s product portfolio:
![BCG Matrix Example][]
Limitations to Consider
The BCG matrix has limitations to keep in mind:
- Market share does not necessarily correlate to profitability
- Rapid growth cannot be sustained forever
- Simple 2×2 does not capture nuances of complex markets
- Based on past data rather than being forward-looking
Use the BCG matrix as a strategic planning tool along with other analyses.
The BCG matrix provides a snapshot of a company’s product portfolio and helps inform plans to invest in, grow or divest products. Follow the steps to correctly construct your matrix. Analyze the results to guide resource allocation and strategic marketing. Use the BCG matrix annually as one tool to maximize your product portfolio performance over time.
What Is a BCG Growth-Share Matrix?
The Boston Consulting Group (BCG) growth-share matrix is a planning tool that uses graphical representations of a company’s products and services in an effort to help the company decide what it should keep, sell, or invest more in.
The matrix plots a company’s offerings in a four-square matrix, with the y-axis representing the rate of market growth and the x-axis representing market share. It was introduced by the Boston Consulting Group in 1970.
- The BCG growth-share matrix is a tool used internally by management to assess the current state of value of a firms units or product lines.
- BCG stands for the Boston Consulting Group, a well-respected management consulting firm.
- The growth-share matrix aids the company in deciding which products or units to either keep, sell, or invest more in.
- The BCG growth-share matrix contains four distinct categories: dogs, cash cows, stars, and question marks.
- The matrix helps companies decide how to prioritize their various business activities.
Example of a BCG Growth Matrix
There are many companies that we can apply the growth matrix to in the real world. Apple (AAPL) is a great candidate. Lets take a look at the products Apple has on the market according to the matrix categories:
- Star: iPhone
- Cash Cow: Macbook
- Question Mark: Apple TV
- Dog: iPad
In 2022, the company earned $394.33 billion in net sales, out of which almost $316.2 billion was attributed to its products section. The remaining $78.13 billion came from its services division:
- Theres no doubt that the majority of Apples sales come from its most popular product. The iPhone brought in $205.49 billion in sales for the year. In this case, its considered the companys star.
- The cash cow for the company is its Mac products—notably the Macbook laptop, which is one of the most popular in this group. Sales for Mac products came in at $40.18 billion for the fiscal year (FY).
- One of the question marks for Apple is its Apple TV streaming service, which falls under the Services category. The competition in the streaming world is intense, with traditional services like Netflix, Hulu, Disney+ dominating the market. But others like YouTube and Vimeo are also eating away at market share. In 2022, Apples Services division earned $78.13 billion in sales.
- Once a darling of the company, the iPad is now considered a dog. Apples tablet continues to show low growth, as sales continue to decline. Sales for the year came in at $29.29 billion, compared to $31.86 billion in 2021.
BCG Matrix (Growth-Share Matrix) EXPLAINED | B2U | Business To You
What are the 4 quadrants of the BCG matrix?
The four quadrants of the BCG Matrix are stars, dogs, cash cows, and question marks. While we’ve roughly covered them above, let’s explore each category a bit closer, using real product examples. A cash cow is a well-established business with stable brands in a mature market.
How do I use a BCG matrix?
Step 1 – Choose the Unit. Strategic Business Units, individual brands, product lines or the firm as a whole are all areas that can be analyzed using the BCG matrix. The chosen unit drives the entire analysis and key definitions. The market, industry, competitors and position will all be based on the chosen unit.
What is the BCG matrix in strategic management?
One of the fundamental tools in strategic management is the BCG Matrix, a simple yet powerful model for analyzing and managing a company’s portfolio of products or services. In this guide, we will look at the role of the BCG matrix in strategic management and how to effectively use it for portfolio analysis and decision making.
What is a good example of a BCG matrix?
A perfect example to demonstrate the BCG matrix could be the BCG matrix of Pepsico. The company has perfected its product mix over the years according to what’s working and what’s not. Here are the four quadrants of Pepsico’s growth-share matrix: Cash Cows – With a US market share of 58.8%, Frito Lay is the biggest cash cow for Pepsico.
