It is changing how businesses understand and use their data as data science is a field that is growing quickly. Because of this, businesses are looking for data scientists more and more to help them make sense of their data and get business results. This has led to a high demand for data scientists, and competition for these positions can be fierce. Below is a list of the 100 most common data science interview questions that we think you will be asked. This will help you prepare for your interview.
There is a short explanation of the main ideas and skills that each interview question tests, along with advice on how to approach and answer the question. You will be well-prepared for your next interview with these data science interview questions if you learn them and practice your answers.
Getting hired as a data scientist is no easy feat. You’ll likely have to go through multiple intense interview rounds testing your skills in statistics, coding, machine learning, and more I recently went through the data science interview grind myself, so I know how daunting it can seem
But don’t worry – with the right preparation, you can absolutely crush your upcoming data science interviews! In this comprehensive guide, I’ll share the most common data science interview questions and detailed answers to help you get ready
Statistics and Probability Questions
Statistics and probability form the basic foundation of data science. Expect to get peppered with questions testing your grasp of key concepts:
Q: What is sampling? Why is it used?
A: Sampling refers to selecting a subset of data points from a larger population. It is used to estimate properties of the whole population without having to analyze every data point. Sampling makes analysis faster, cheaper, and more feasible. Common sampling methods include simple random, systematic, stratified, and cluster sampling.
Q: Explain the difference between Type I and Type II errors.
A Type I error occurs when we reject a true null hypothesis, while Type II error occurs when we fail to reject a false null hypothesis In other words, Type I is a false positive and Type II is a false negative Minimizing Type I errors reduces false alarms, while minimizing Type II errors improves sensitivity.
Q: How is a confidence interval interpreted?
A: A 95% confidence interval suggests we are 95% confident the true population parameter lies within the interval. Wider intervals indicate less precision, while more observations and lower variance lead to narrower confidence intervals.
Python Coding Questions
Expect coding questions ranging from simple Python syntax and NumPy fundamentals to pandas dataframe manipulation and machine learning implementations. Here are some common examples:
Q: How do you reverse a list in Python?
A: There are a few ways to reverse a list in Python:
- Use reversed() and convert to list:
my_list = [1, 2, 3] reversed_list = list(reversed(my_list))- Use [::-1] slice notation:
my_list = [1, 2, 3]reversed_list = my_list[::-1]- Use the reverse() method in-place:
my_list = [1, 2, 3]my_list.reverse() print(my_list) # [3, 2, 1]Q: How do you handle missing values in a pandas dataframe?
A: There are many approaches to handling missing data in pandas:
- Drop rows/columns with
dropna() - Fill missing values with a constant like mean, median or mode using
fillna() - Interpolate missing values with
interpolate() - Build predictive models to estimate missing values
- Treat missing values as a separate category
The best method depends on the amount and type of missing values in the dataset.
Q: Write a function that takes two arrays and returns their element-wise product.
import numpy as npdef elementwise_product(array1, array2): return np.multiply(array1, array2) a = np.array([1, 2, 3])b = np.array([4, 5, 6])print(elementwise_product(a, b)) # [ 4 10 18]Machine Learning Questions
You’ll need solid machine learning fundamentals to tackle algorithmic and model-building interview questions:
Q: Explain overfitting. How can you prevent it?
A: Overfitting occurs when a model fits the training data too well but generalizes poorly to new data. Solutions include:
- Reducing model complexity (parameters, layers)
- Getting more training data
- Regularization methods like L1/L2 regularization
- Early stopping
- Dropout layers in neural networks
Overfitting can be detected by a gap in performance between train and validation/test sets.
Q: What is logistic regression? When is it used?
A: Logistic regression is used for binary classification problems. It uses the sigmoid function to predict the probability of the target being 0 or 1. Logistic regression is used when the dependent variable is categorical.
Q: You are given an imbalanced binary classification dataset. How would you approach building a model for it?
A: Class imbalance can bias models towards the majority class. Solutions include:
- Oversample minority class
- Undersample majority class
- Generate synthetic samples from minority class
- Try different algorithms e.g. SVM, random forest
- Use class weights to penalize misclassifications
- Choose evaluation metrics like F1-score that account for imbalance
SQL Interview Questions
It never hurts to brush up on your SQL skills before an interview. Here are some common questions on writing queries and working with databases:
Q: Write a query to return the top 5 highest paid employees.
SELECT employee_name, salary FROM employeesORDER BY salary DESCLIMIT 5;Q: You have a table with employee information. How would you find employees who have worked at the company for over 5 years?
SELECT employee_name, start_dateFROM employeesWHERE start_date < DATE_SUB(CURDATE(), INTERVAL 5 YEAR); DATE_SUB() subtracts 5 years from the current date (CURDATE()).
Q: Explain different types of SQL joins.
- INNER JOIN: Returns rows with matching keys in both tables.
- LEFT JOIN: Returns all rows from left table plus matched rows from right table.
- RIGHT JOIN: Returns all rows from right table plus matched rows from left table.
- FULL OUTER JOIN: Returns all rows from both tables, matches or not.
Bonus Tips for Interview Success
With thorough preparation, you can walk into your data science interview feeling self-assured. Here are some final tips:
- Review your own projects and refresh knowledge of models used
- Practice mock interviews to sharpen communication skills
- Brush up data science fundamentals with online courses
- Stay up-to-date on latest industry trends and tools
- Ask smart, thoughtful questions to your interviewers
- Rest up and visualize yourself excelling on interview day
Intermediate Interview Questions on Statistics for Data Science
A. The Central Limit Theorem is one of the most important ideas in statistics. It says that as the sample size grows, the sample mean’s distribution will become more like a normal distribution. This is true regardless of the underlying distribution of the population from which the sample is drawn. This means that we can use methods based on normal distribution to draw conclusions about the population even if some of the data points in a sample are not normally distributed. All we have to do is take the average of a large enough number of them.
A. The two kinds of target variables are:
Number-based or continuous variables: Their values are in a range, and they can be any number between that range and the time of the prediction. Values don’t have to be from the same range, though.
For example: Height of students – 5; 5.1; 6; 6.7; 7; 4.5; 5.11
Here the range of the values is (4,7)
And, the height of some new students can/cannot be any value from this range.
You can only put a categorical variable into one of a small, usually fixed number of possible values. This means that each person or thing you observe fits into a certain group based on a qualitative property.
This type of categorical variable can only have two possible values. It is also known as a dichotomous variable. Categorical variables with more than two possible values are called polytomous variables.
For example Exam Result: Pass, Fail (Binary categorical variable)
The blood type of a person: A, B, O, AB (polytomous categorical variable)
A. The mean, median, and mode of a dataset will all be the same if and only if the dataset is made up of a single value that happens 10% of the time.
For example, consider the following dataset: 3, 3, 3, 3, 3, 3. The mean of this dataset is 3, the median is 3, and the mode is 3. This is because the dataset consists of a single value (3) that occurs with 100% frequency.
If, on the other hand, the dataset has more than one value, the mean, median, and mode will usually be different. For example, consider the following dataset: 1, 2, 3, 4, 5. The mean of this dataset is 3, the median is 3, and the mode is 1. This is because the dataset contains multiple values, and no value occurs with 100% frequency.
It is important to keep in mind that outliers, or very high or low values in the dataset, can change the mean, median, and mode. If the dataset has some very high or very low values, the mode may be very different from the mean and median. This is also true if the dataset only has one very high or very low value.
A. In statistics, variance, and bias are two measures of the quality or accuracy of a model or estimator.
Variance: Variance measures the amount of spread or dispersion in a dataset. It is calculated as the average squared deviation from the mean. If the variance is high, the data are spread out and may be more likely to be wrong. If the variance is low, the data are close to the mean and may be more accurate.
There is a difference between what an estimator is supposed to do and what it actually does. This is called bias. An estimator with a high bias consistently under- or over-estimates the true value. An estimator with a low bias, on the other hand, is more accurate.
It is important to consider both variance and bias when evaluating the quality of a model or estimator. To overfit, a model with low bias and high variance might be a bad idea. To underfit, a model with high bias and low variance might be even worse. Finding the right balance between bias and variance is an important aspect of model selection and optimization.
A. Two types of errors can occur in hypothesis testing: Type I errors and Type II errors.
When the null hypothesis is true but is thrown out, this is called a Type I error, also called a “false positive.” This kind of mistake is shown by the Greek letter alpha (α), and its level is usually set to 0. 05. This means that there is a 5% chance of making a Type I error or a false positive.
It is a Type II error, also called a “false negative,” when the null hypothesis is wrong but not thrown out. The Greek letter beta (²) stands for this kind of mistake, which is often shown as 1 – ², where ² is the test’s power. The power of the test is the probability of correctly rejecting the null hypothesis when it is false.
It’s important to try to minimize the chances of both types of errors in hypothesis testing.
A. It’s the range of possible outcomes that we think the results will fall into if we do the experiment again. It is the mean of the result plus and minus the expected variation.
The standard error of the estimate tells us what that is, and the mean of the estimate is in the middle of the interval. The most common confidence interval is 95%.
A. Correlation is a statistical measure that describes the strength and direction of a linear relationship between two variables. A positive correlation means that the two variables go up or down at the same rate, while a negative correlation means that they move in opposite directions. Covariance is a measure of the joint variability of two random variables. It is used to measure how two variables are related.
Interview Questions Regarding EDA and Statistics
A. Univariate analysis is a statistical technique used to analyze and describe the characteristics of a single variable. It can help you understand the central tendency, dispersion, and distribution of a variable, as well as find patterns and connections in the data. Here are the steps for performing univariate analysis for numerical and categorical variables:
For numerical variables:
- Find descriptive statistics like the mean, median, mode, and standard deviation to get a sense of how the data is spread out.
- Use plots like histograms, boxplots, and density plots to see how the data is spread out.
- Check for outliers and anomalies in the data.
- Statistical tests or graphs like a Q-Q plot can be used to see if the data is normal.
- Find the number of times or frequencies of each category in the data.
- Figure out what percentage of the data each category makes up.
- Use plots like bar plots and pie charts to see how the data is spread out.
- Look for uneven or strange patterns in how the data is spread out.
Keep in mind that the exact steps you need to take to do univariate analysis may change based on your needs and the goals of the analysis. If you want to accurately describe and understand the data, you need to carefully plan and carry out the analysis.
A. Outliers are data points that are significantly different from the majority of the data. They can be caused by mistakes, oddities, or strange events, and they can have a big effect on statistical analyses and machine learning models. Therefore, it is important to identify and handle outliers appropriately in order to obtain accurate and reliable results.
Here are some common ways to find outliers in the data:
Look at the data: Outliers are often easy to spot by looking at the data with plots like histograms, scatterplots, or boxplots.
To find outliers, you can sometimes use summary statistics like the mean, median, or interquartile range to find them and then compare them to the data. For example, if the mean is significantly different from the median, it could indicate the presence of outliers.
When you look at a data point, its z-score tells you how far away it is from the mean. Data points with a z-score greater than a certain threshold (e. g. , 3 or 4) can be considered outliers.
Besides these two methods, there are many others that can be used to find outliers in data. The best one will depend on the data and what it needs. It is important to think about and pick the best way to find outliers so that you can get accurate and trustworthy results.
A. There are several ways that you can impute null values (i.e., missing values) in a dataset:
Drop rows: One option is to simply drop rows with null values from the dataset. This is a quick and easy way to do things, but if a lot of rows are dropped, it can hurt the statistical power of the analysis because the sample size will be much smaller.
Drop columns: Another option is to drop columns with null values from the dataset. This might be a good choice if there are a lot of null values compared to non-null values or if the column has nothing to do with the analysis.
Null values are often filled in with the mean or median of the values that aren’t null in the column. This is called imputation with mean or median. This can be a good choice if some data points are missing and the mean or median is a good way to show what the data points are like.
Imputation with mode: Another option is to replace null values with the mode (i. e. , the most common value) of the non-null values in the column. This might be a good choice for categorical data where the mode is a good way to show the data.
Using a predictive model to guess the missing values: Another way to do imputation is to use a predictive model to look at the other data and guess the missing values. If the data are missing for a good reason and there is a strong link between the missing values and the other data, this method may be more accurate, but it may be harder to use and take more time.
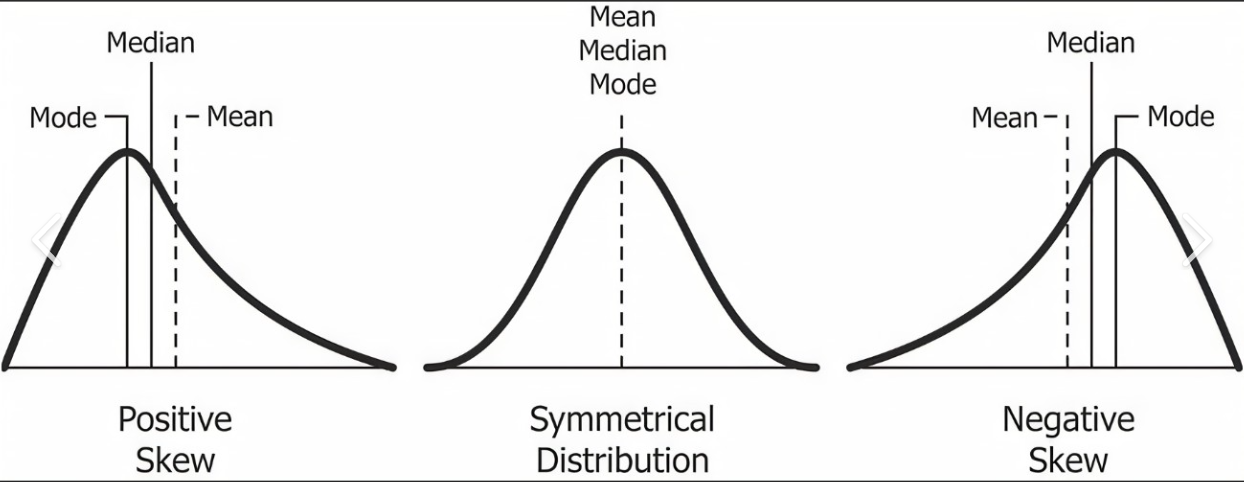
A. Skewness is a measure of the symmetry of a distribution. If the distribution looks like a bell curve with most of the points close to the mean, it is said to be symmetrical. If more of the data points are on one side of the mean than the other, the distribution is said to be skewed.
There are two types of skewness: positive skewness and negative skewness.
- Positive skewness: The distribution is positive skewened when it has a long tail on the right side and most of the data points are on the left side of the mean. If the skewness is positive, it means that there are a few very high or very low values on the right side of the distribution that are pushing the mean to the right.
- Negative skewness: The distribution is negative skew if it has a long tail on the left side and most of the data points are on the right side of the mean. There are some very high or very low values on the left side of the distribution that are pulling the mean to the left, which is shown by negative skewness.
A. In statistics, measures of central tendency are values that represent the center of a dataset. There are three main measures of central tendency: mean, median, and mode.
The average of a set of numbers is called the mean. To find the mean, add up all the numbers in the set and divide by the number of numbers. Outliers, or values that are much higher or lower than most of the other values in the dataset, can throw off the mean.
When you put the values in a set in order from smallest to largest, the median is the value that falls in the middle. To find the median, you must first arrange the values in order and then locate the middle value. If there is an odd number of values, the median is the middle value. If there is an even number of values, the median is the mean of the two middle values. The median is not sensitive to outliers.
The mode is the value that occurs most frequently in a dataset. A dataset may have multiple modes or no modes at all. The mode is not sensitive to outliers.
A. Descriptive statistics use measures of central tendency (like mean, median, and mode) and measures of spread (like standard deviation, variance, and range) to sum up and describe a set of data. You can draw conclusions about a whole population from a small group of data by using statistical models, testing hypotheses, and guesswork.
A. Univariate analysis, bivariate analysis, missing data analysis, and basic data visualization are some of the most important parts of an EDA report. Univariate analysis helps you understand how different variables are spread out, bivariate analysis helps you understand how variables are related to each other, missing data analysis helps you understand how good the data is, and data visualization gives you a visual way to understand the data.
Data Science Interview Questions | Data Science Tutorial | Data Science Interviews | Edureka
FAQ
What are the 4 types of data science?
Are data scientist interviews hard?
What are the most popular data science interview questions?
Here’s a list of the most popular data science interview questions on the technical concept which you can expect to face, and how to frame your answers. 1. What are the differences between supervised and unsupervised learning? Become a Data Scientist with Hands-on Training! 2. How is logistic regression done?
How do I prepare for a data science interview?
Reading the most common interview questions : product sense, statistical, analytical, behavioral, and leadership questions. Taking mock interview: practice an interview with a friend, improve your statical vocabulary, and become confident. Read the Data Science Interview Preparation blog to learn what to expect and how to approach the interview.
How long does it take to become a data scientist?
If you have a background in math or computer science, then you can transition into data science easily. But if you don’t have this background, then you should give yourself at least six months to get familiar with the math and coding skills that are required. If an Interviewer Asks, “Why Should We Hire You as a Data Scientist?”
What questions do interviewers ask a data scientist?
Interviewers ask general data science interview questions to learn about your personality, work ethic and career goals. Review the following 10 examples: Tell me about yourself. Why did you decide to become a data scientist? What are your strengths and weaknesses as a data scientist? Do you prefer to work in a team or work alone?

